Past performance is not an indicator of future results.
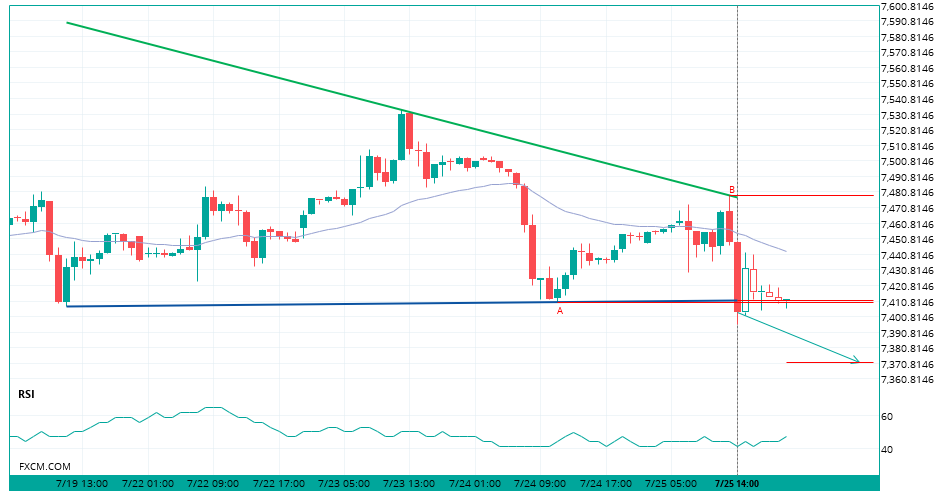
UK100 has broken through a support line of a Descending Triangle chart pattern. If this breakout holds true, we expect the price of UK100 to test 7371.0835 within the next 21 hours. But don’t be so quick to trade, it has tested this line in the past, so you should probably confirm the breakout before placing any trades.
Risk warning: Our service includes products that are traded on margin and carry a risk of losses in excess of your deposited funds. The products may not be suitable for all investors. Please ensure that you fully understand the risks involved.
Any opinions, news, research, analyses, prices, other information, or links to third-party sites contained on this website are provided on an “as-is” basis, as general market commentary and do not constitute investment advice. The market commentary has not been prepared in accordance with legal requirements designed to promote the independence of investment research, and it is therefore not subject to any prohibition on dealing ahead of dissemination. Although this commentary is not produced by an independent source, FXCM takes all sufficient steps to eliminate or prevent any conflicts of interests arising out of the production and dissemination of this communication. The employees of FXCM commit to acting in the clients’ best interests and represent their views without misleading, deceiving, or otherwise impairing the clients’ ability to make informed investment decisions. For more information about the FXCM’s internal organizational and administrative arrangements for the prevention of conflicts, please refer to the Firms’ Managing Conflicts Policy. Please ensure that you read and understand our Full Disclaimer and Liability provision concerning the foregoing Information, which can be accessed here.High Risk Investment Notice: Trading forex/CFD's on margin carries a high level of risk and may not be suitable for all investors as you could sustain losses in excess of deposits. Leverage can work against you. Be aware and fully understand all risks associated with the market and trading. Prior to trading any products offered by Forex Capital Markets Limited, inclusive of all EU branches, FXCM Australia Pty. Limited, FXCM South Africa (PTY) LTD, any affiliates of aforementioned firms, or other firms within the FXCM group of companies [collectively the "FXCM Group"], carefully consider your financial situation and experience level. If you decide to trade products offered by FXCM Australia Pty. Limited ("FXCM AU") (AFSL 309763), you must read and understand the Financial Services Guide, Product Disclosure Statement and Terms of Business. Our FX and CFD prices are set by us, are not made on an Exchange and are not governed under the Financial Advisory and Intermediary Services Act. The FXCM Group may provide general commentary which is not intended as investment advice and must not be construed as such. Seek advice from a separate financial advisor. The FXCM Group assumes no liability for errors, inaccuracies or omissions; does not warrant the accuracy, completeness of information, text, graphics, links or other items contained within these materials. Read and understand the Terms and Conditions on the FXCM Group's websites prior to taking further action.
The FXCM Group is headquartered at 20 Gresham Street, 4th Floor, London EC2V 7JE, United Kingdom. Forex Capital Markets Limited ("FXCM LTD") is authorised and regulated in the UK by the Financial Conduct Authority. Registration number 217689. Registered in England and Wales with Companies House company number 04072877. FXCM Australia Pty. Limited ("FXCM AU") is regulated by the Australian Securities and Investments Commission, AFSL 309763. FXCM AU ACN: 121934432. FXCM South Africa (PTY) Ltd is an authorized Financial Services Provider and is regulated by the Financial Sector Conduct Authority under registration number 46534. FXCM Markets Limited ("FXCM Markets") is an operating subsidiary within the FXCM Group. FXCM Markets is not regulated and not subject to the regulatory oversight that govern other FXCM Group entities, which includes but is not limited to the Financial Conduct Authority, Financial Sector Conduct Authority, and the Australian Securities and Investments Commission. FXCM Global Services, LLC is an operating subsidiary within the FXCM Group. FXCM Global Services, LLC is not regulated and not subject to regulatory oversight.

