A potential bearish movement on GBPUSD
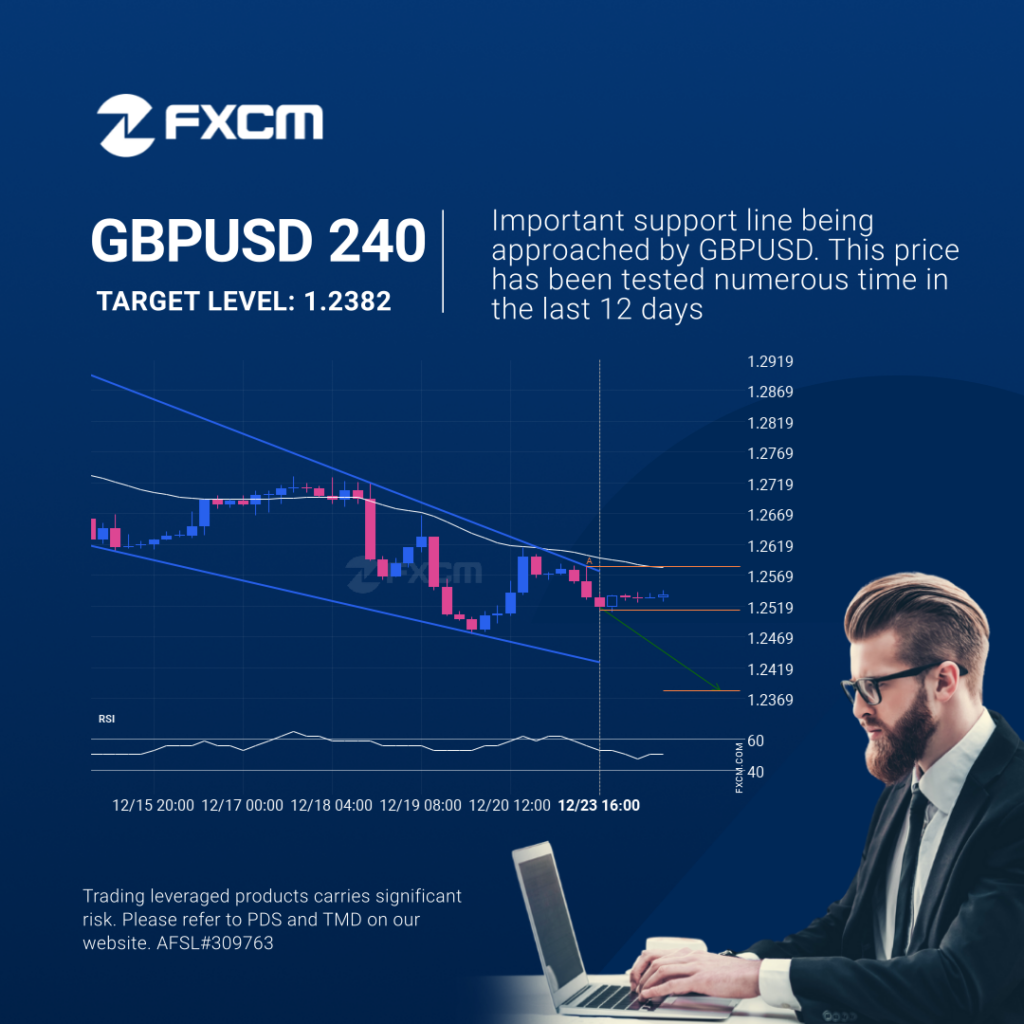
GBPUSD was identified at around 1.25125 having recently rebounded of the resistance on the 4 hour data interval. Ultimately, the price action of the stock has formed a Falling Wedge pattern. This squeeze may increases the chances of a strong breakout. The projected movement will potentially take the price to around the 1.2382 level. Past […]
A potential bearish movement on GBPUSD

GBPUSD was identified at around 1.25125 having recently rebounded of the resistance on the 4 hour data interval. Ultimately, the price action of the stock has formed a Falling Wedge pattern. This squeeze may increases the chances of a strong breakout. The projected movement will potentially take the price to around the 1.2382 level. Past […]
GBPUSD – Patrón de gráfico Continuation – Cuña descendente
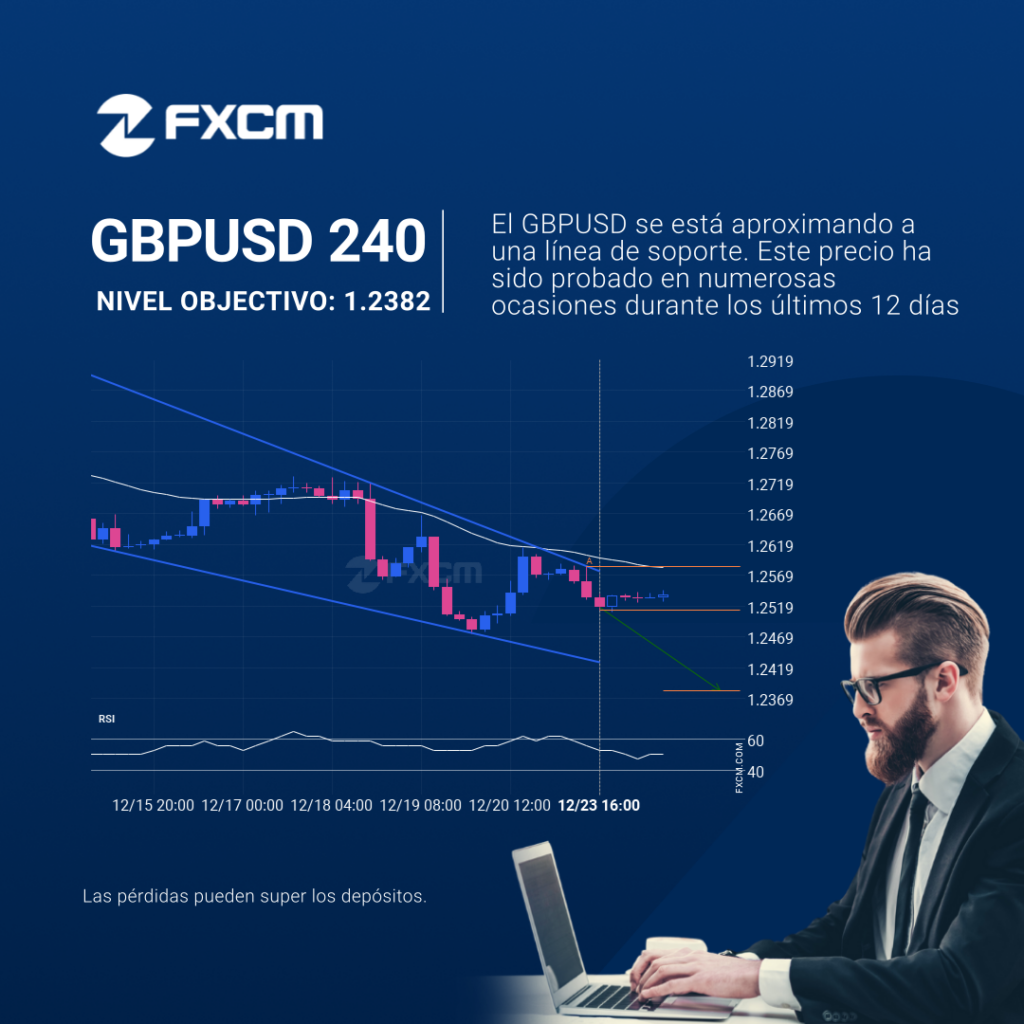
Se identificó un patrón de Cuña descendente en GBPUSD en 1.25125, lo que generó la expectativa de que podría moverse a la línea de soporte en 1.2382. Puede atravesar esa línea y continuar la tendencia bajista o puede girarse desde esa línea. El rendimiento pasado no es indicativo de resultados futuros. Las pérdidas pueden exceder […]
A potential bearish movement on GBPUSD
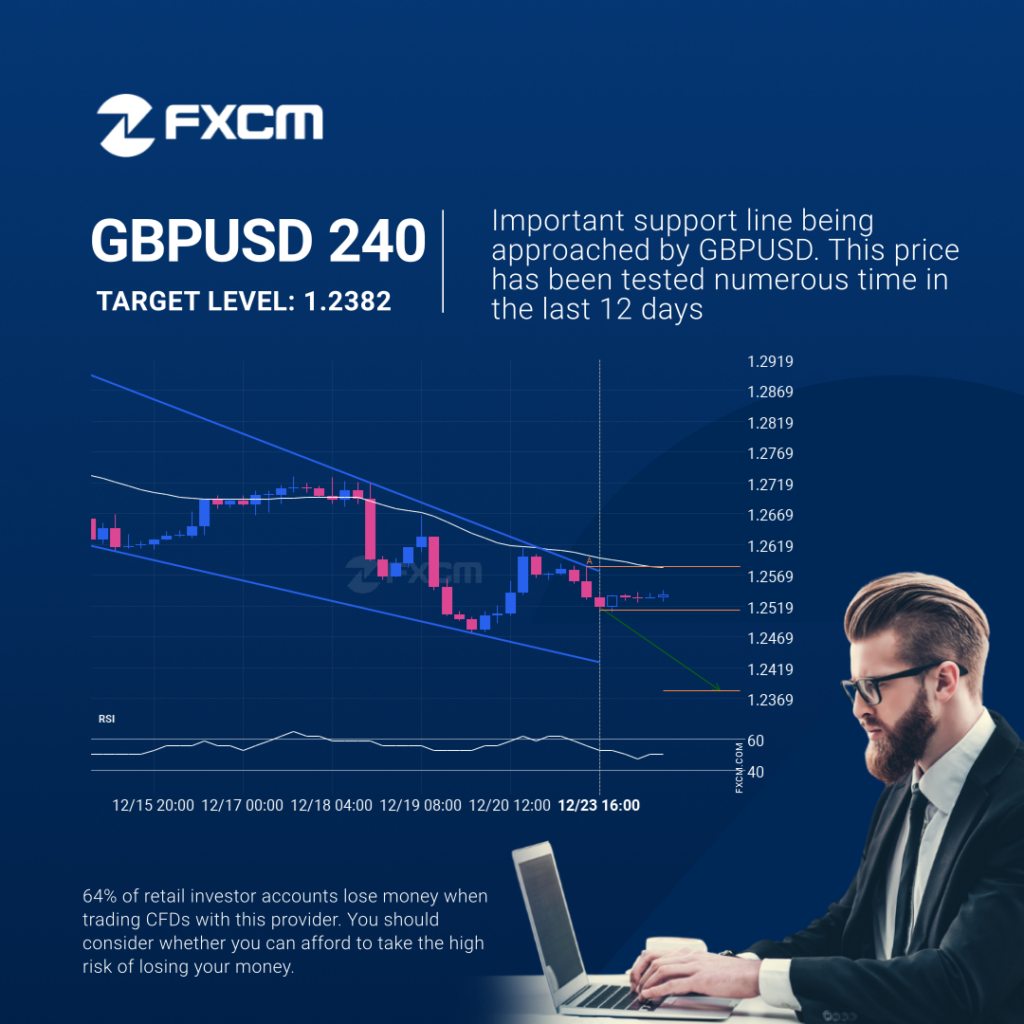
GBPUSD was identified at around 1.25125 having recently rebounded of the resistance on the 4 hour data interval. Ultimately, the price action of the stock has formed a Falling Wedge pattern. This squeeze may increases the chances of a strong breakout. The projected movement will potentially take the price to around the 1.2382 level. Past […]
Dramatic change in NZDUSD. A sign of things to come?
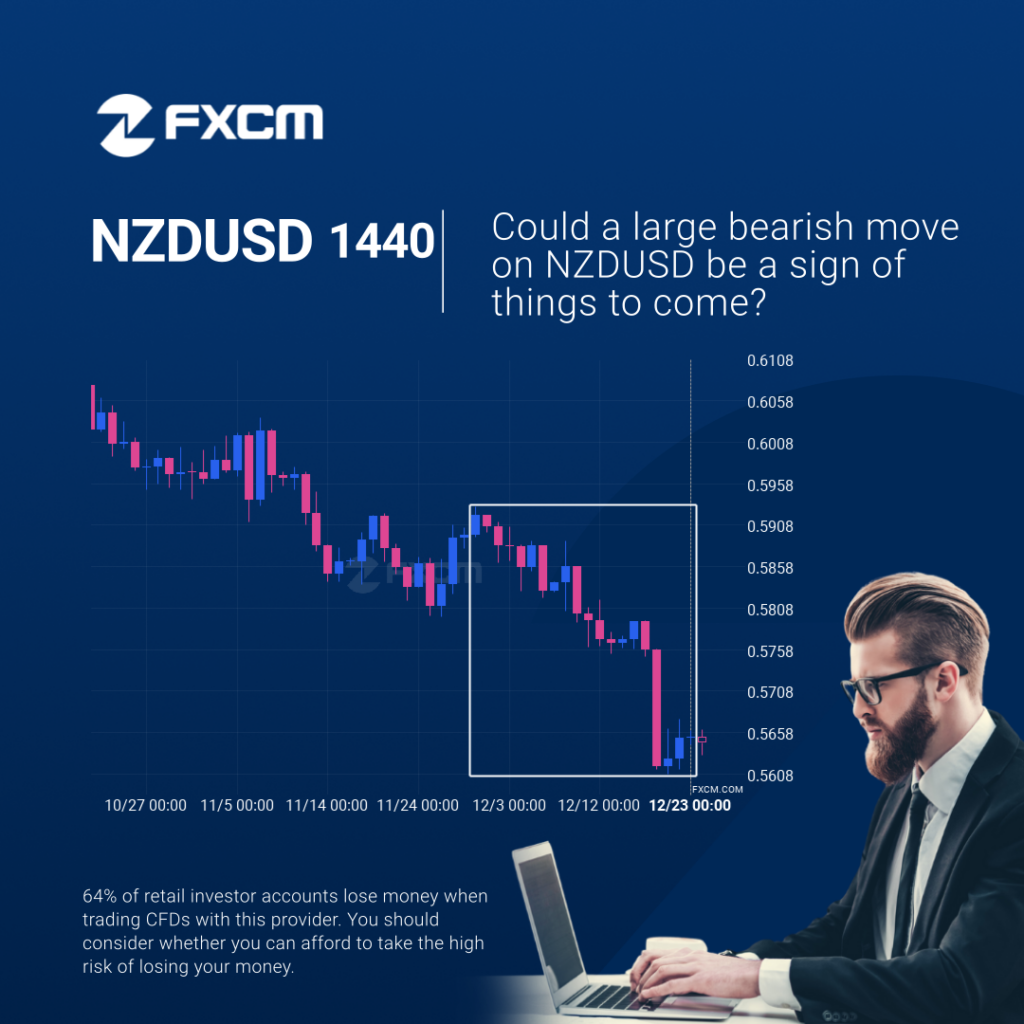
NZDUSD dropped sharply for 24 days – which is an excessively big movement for this instrument; exceeding the 98% of past price moves. Even if this move is a sign of a new trend in NZDUSD there is a chance that we will witness a correction, no matter how brief. Past performance is not an […]
Dramatic change in NZDUSD. A sign of things to come?
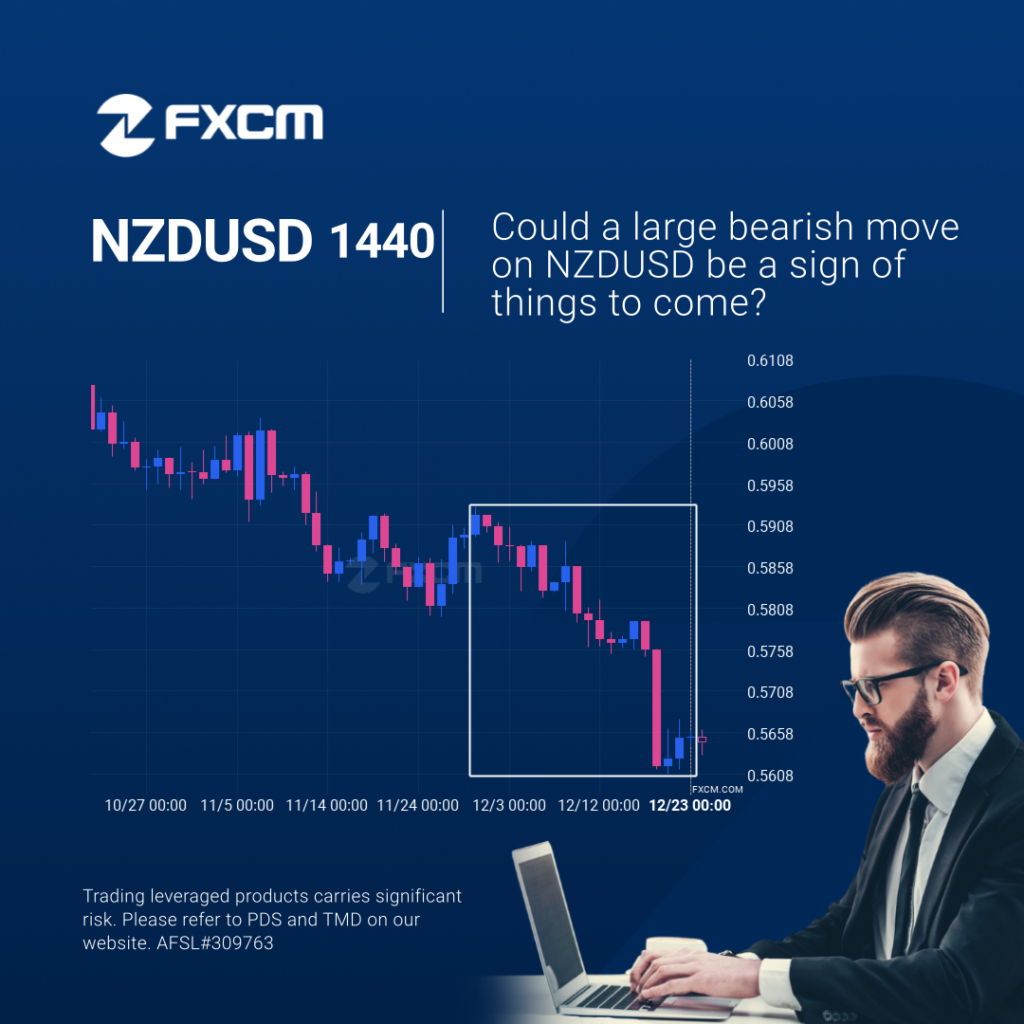
NZDUSD dropped sharply for 24 days – which is an excessively big movement for this instrument; exceeding the 98% of past price moves. Even if this move is a sign of a new trend in NZDUSD there is a chance that we will witness a correction, no matter how brief. Past performance is not an […]
Cambio dramático en NZDUSD. ¿Una muestra de lo que vendrá?
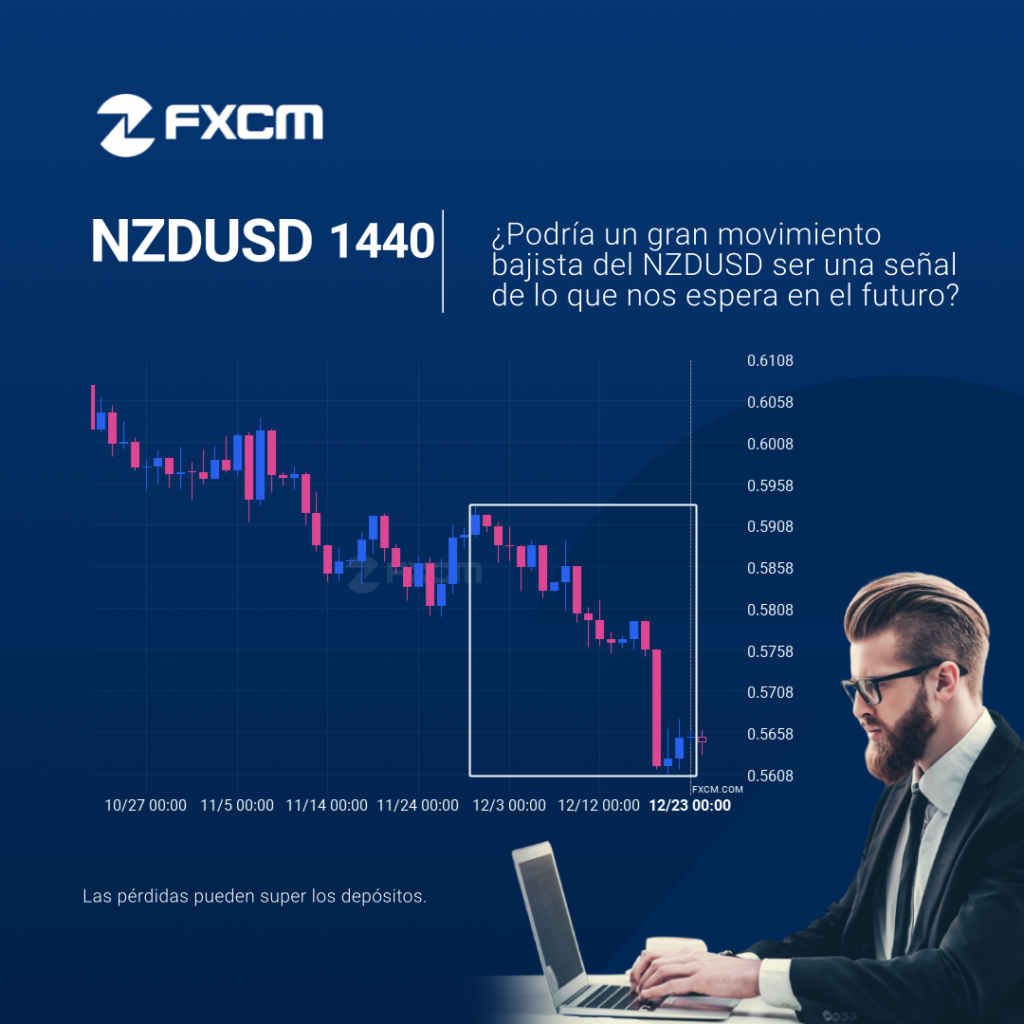
NZDUSD bajó bruscamente durante 24 días – lo cual es un movimiento excesivamente grande para este instrumento; excediendo el 98% de los movimientos de precios anteriores. Incluso si este movimiento es una señal de una nueva tendencia en NZDUSD, existe la posibilidad de que presenciemos una corrección, por breve que sea. El rendimiento pasado no […]
Dramatic change in NZDUSD. A sign of things to come?
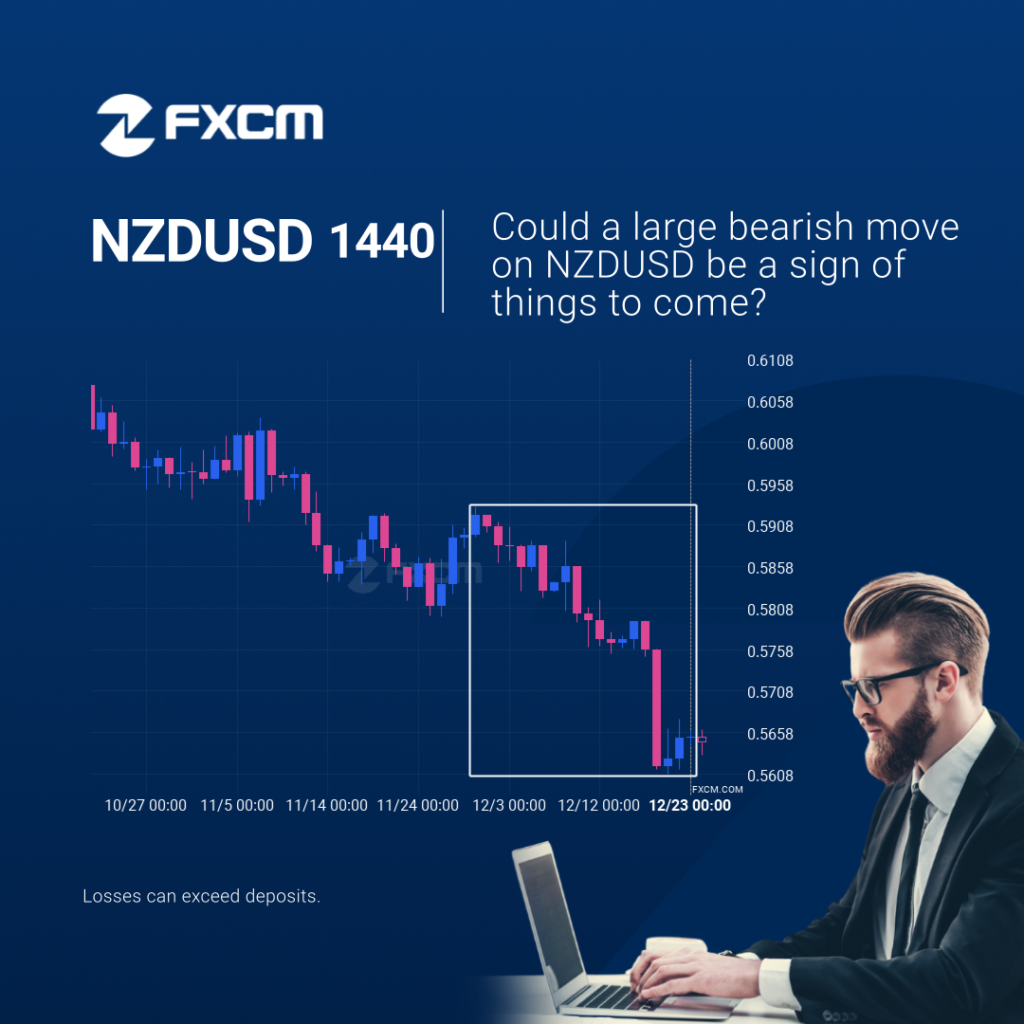
NZDUSD dropped sharply for 24 days – which is an excessively big movement for this instrument; exceeding the 98% of past price moves. Even if this move is a sign of a new trend in NZDUSD there is a chance that we will witness a correction, no matter how brief. Past performance is not an […]
USDCAD was on its way up
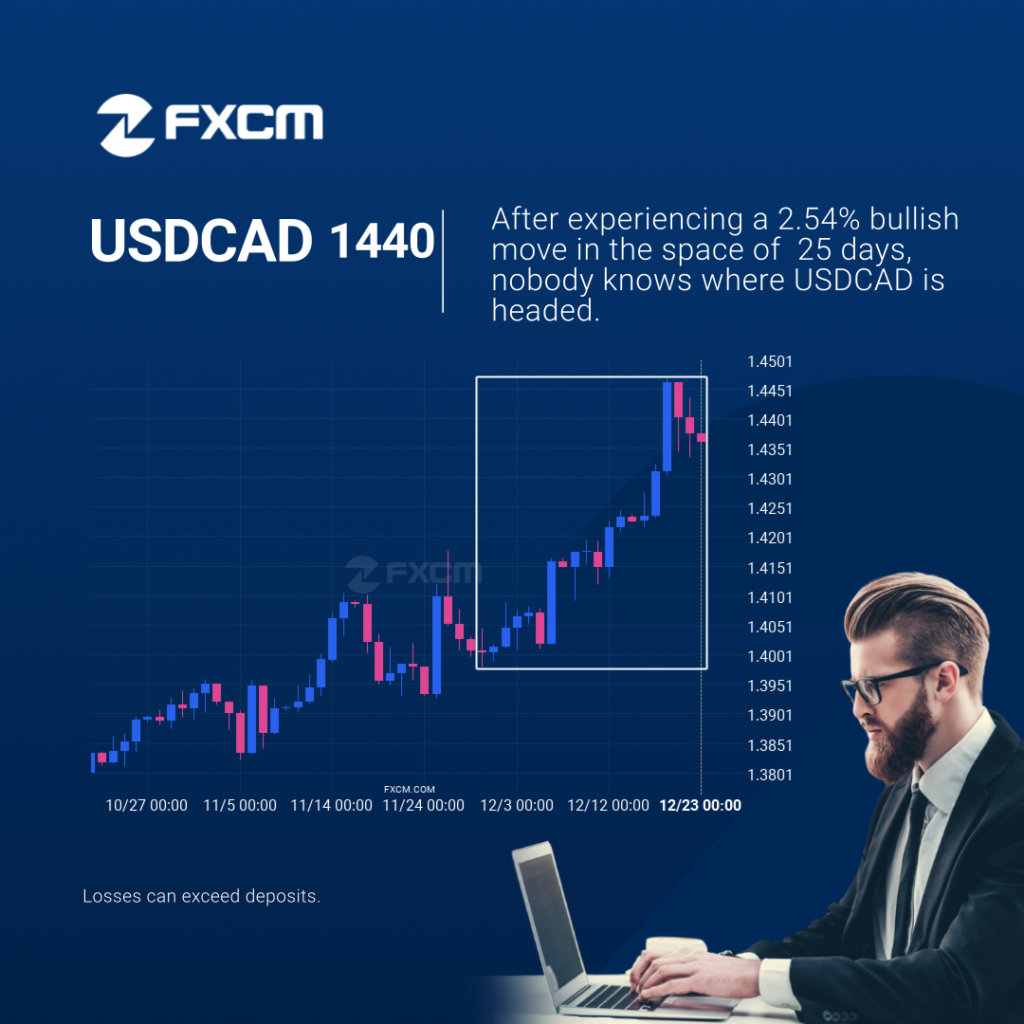
An unexpected large move has occurred on USDCAD Daily chart beginning at 1.40045 and ending at 1.43604. Is this a sign of something new? What can we expect in the future? Past performance is not an indicator of future results. Losses can exceed deposits.
El BTCUSD se aproxima a el soporte de un Canal bajista

BTCUSD está atrapado en una formación de Canal bajista, lo que implica que una rotura es inminente. Esta es una excelente configuración de trading tanto para los operadores de tendencia como para los de swing. Ahora se está acercando a una línea de resistencia que se testeó en el pasado. Los oportunistas de la divergencia […]