Posible comienzo de una tendencia alcista cuando HKG33 rompa el nivel de resistencia

HKG33 está testeando una vez más el nivel clave de resistencia horizontal en 19970.0293. Ha testeado este nivel 3 veces recientemente y podría simplemente rebotar como lo hizo la última vez. Sin embargo, después de tantos intentos, tal vez esté a punto para empezar una nueva tendencia. El rendimiento pasado no es indicativo de resultados […]
BTCUSD – Continuation Patrón de gráfico – Rectángulo

El movimiento del BTCUSD hacia la línea de soporte de un Rectángulo es otra prueba más de la línea que ha alcanzado en numerosas ocasiones durante el pasado. Esta prueba de la línea podría ocurrir en las próximas 2 días, pero no sabemos si dará como resultado una ruptura a través de esta línea o […]
Is NZDUSD likely to correct after this massive movement?
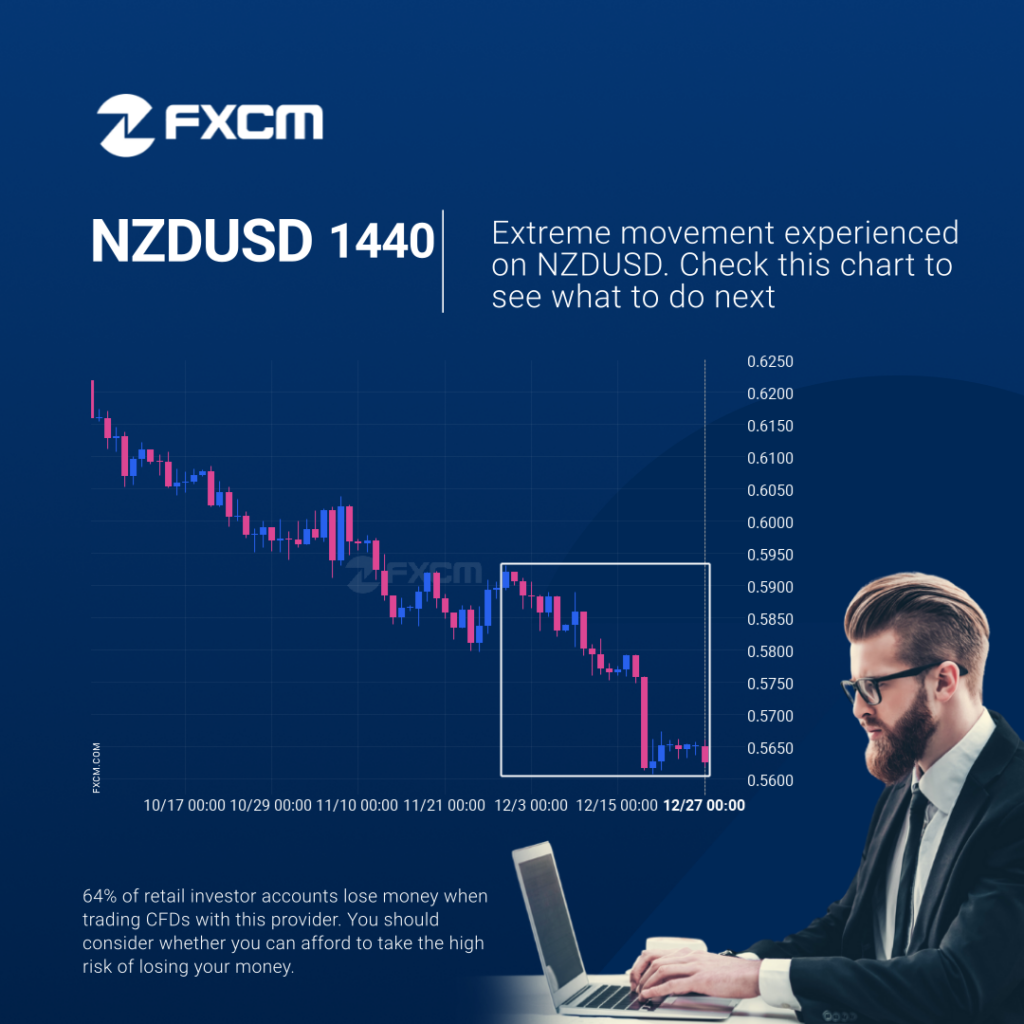
NZDUSD experienced an extremely large move that lasted 29. This movement is in the 5.0 percentile and is uncommon. It is not unusual to witness a pullback after such a big movement. Past performance is not an indicator of future results. 64% of retail investor accounts lose money when trading CFDs with this provider. You […]
¿Es probable que NZDUSD corrija después de este gran movimiento?
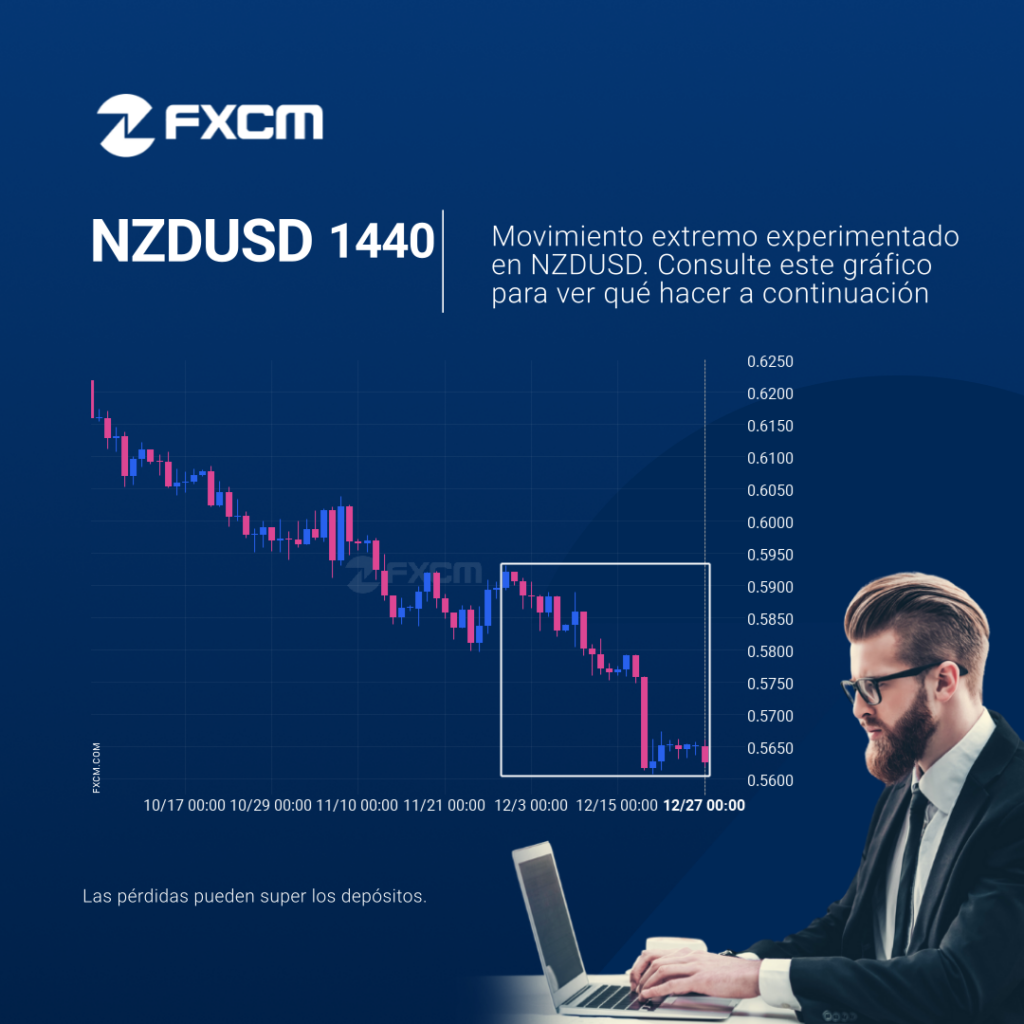
NZDUSD experimentó un movimiento extremadamente grande que duró 29. Este movimiento está en el percentil 5.0 y es poco común. No es inusual presenciar un retroceso después de un movimiento tan grande. El rendimiento pasado no es indicativo de resultados futuros. Las pérdidas pueden exceder los fondos depositados.
Is NZDUSD likely to correct after this massive movement?
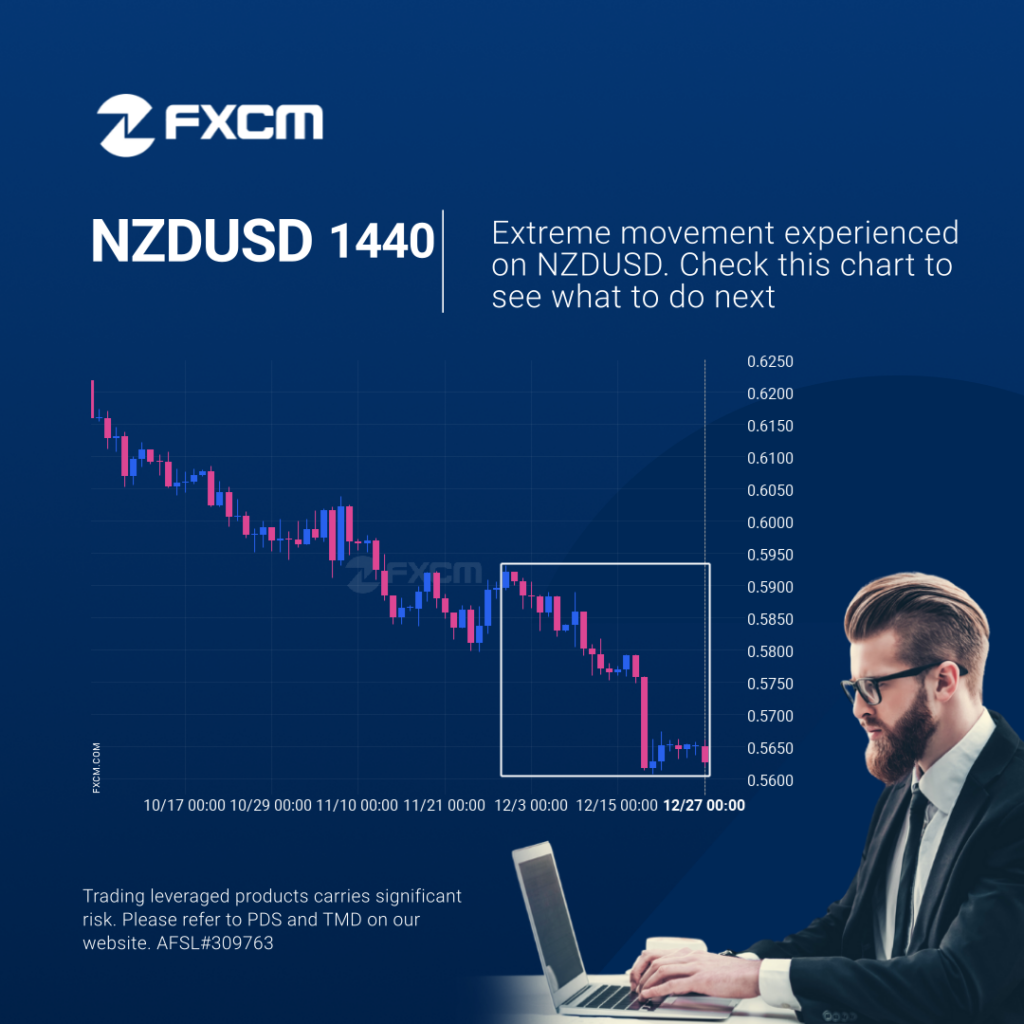
NZDUSD experienced an extremely large move that lasted 29. This movement is in the 5.0 percentile and is uncommon. It is not unusual to witness a pullback after such a big movement. Past performance is not an indicator of future results. Trading leveraged products carries significant risk. Please refer to PDS and TMD on our […]
Possible start of a bullish trend as HKG33 breaks resistance

HKG33 is once again retesting a key horizontal resistance level at 19970.0293. It has tested this level 3 times in the recent past and could simply bounce off like it did last time. However, after this many tries, maybe it’s ready to start a new trend. Past performance is not an indicator of future results. […]
Is NZDUSD likely to correct after this massive movement?
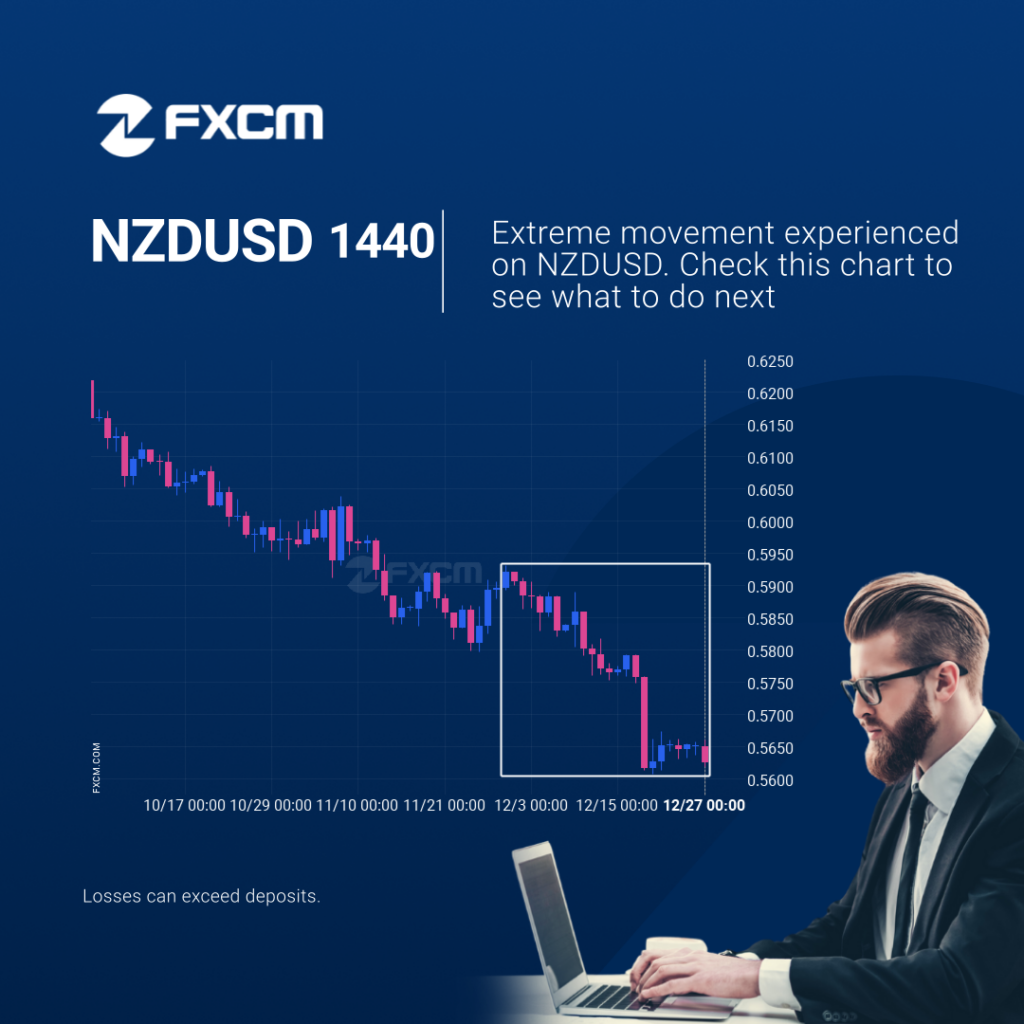
NZDUSD experienced an extremely large move that lasted 29. This movement is in the 5.0 percentile and is uncommon. It is not unusual to witness a pullback after such a big movement. Past performance is not an indicator of future results. Losses can exceed deposits.
Possible start of a bullish trend as HKG33 breaks resistance
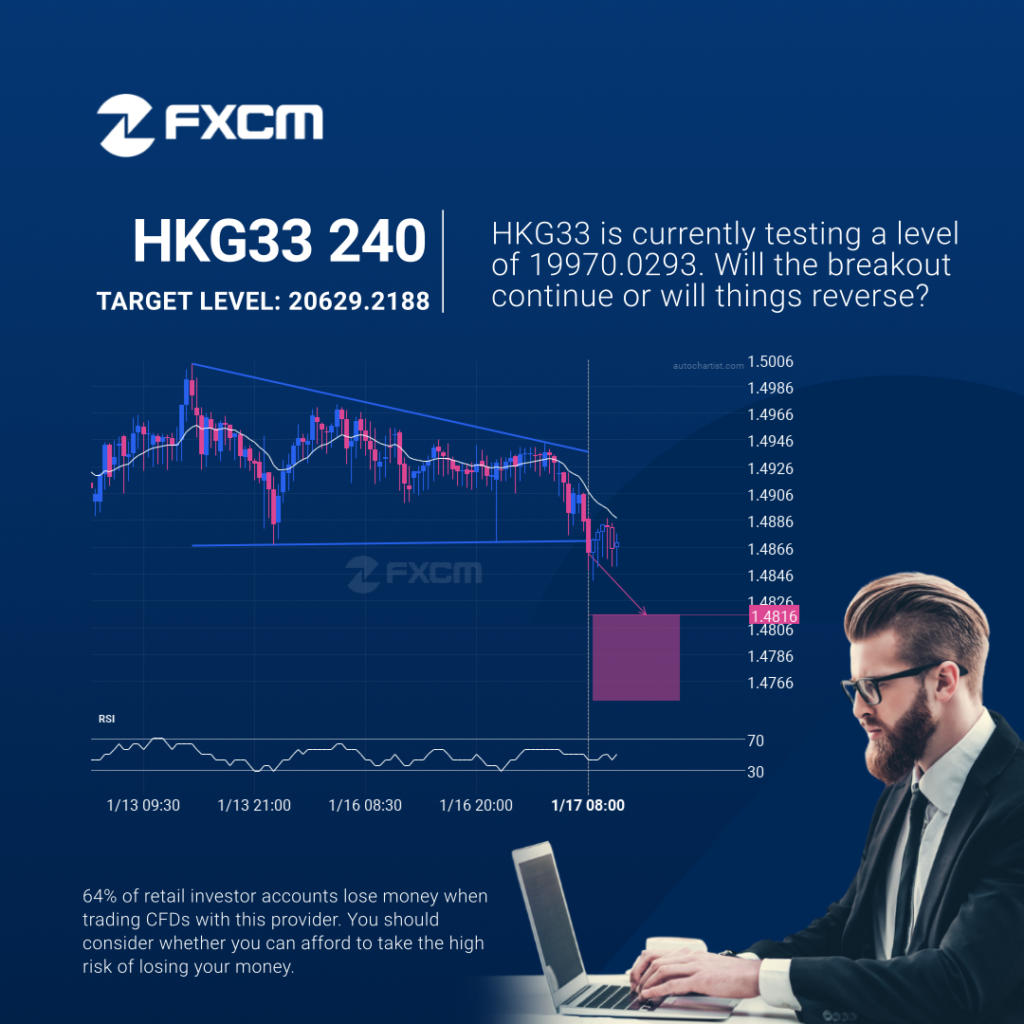
HKG33 is once again retesting a key horizontal resistance level at 19970.0293. It has tested this level 3 times in the recent past and could simply bounce off like it did last time. However, after this many tries, maybe it’s ready to start a new trend. Past performance is not an indicator of future results. […]
Possible start of a bullish trend as HKG33 breaks resistance

HKG33 is once again retesting a key horizontal resistance level at 19970.0293. It has tested this level 3 times in the recent past and could simply bounce off like it did last time. However, after this many tries, maybe it’s ready to start a new trend. Past performance is not an indicator of future results. […]
Resistance line breached by EURGBP
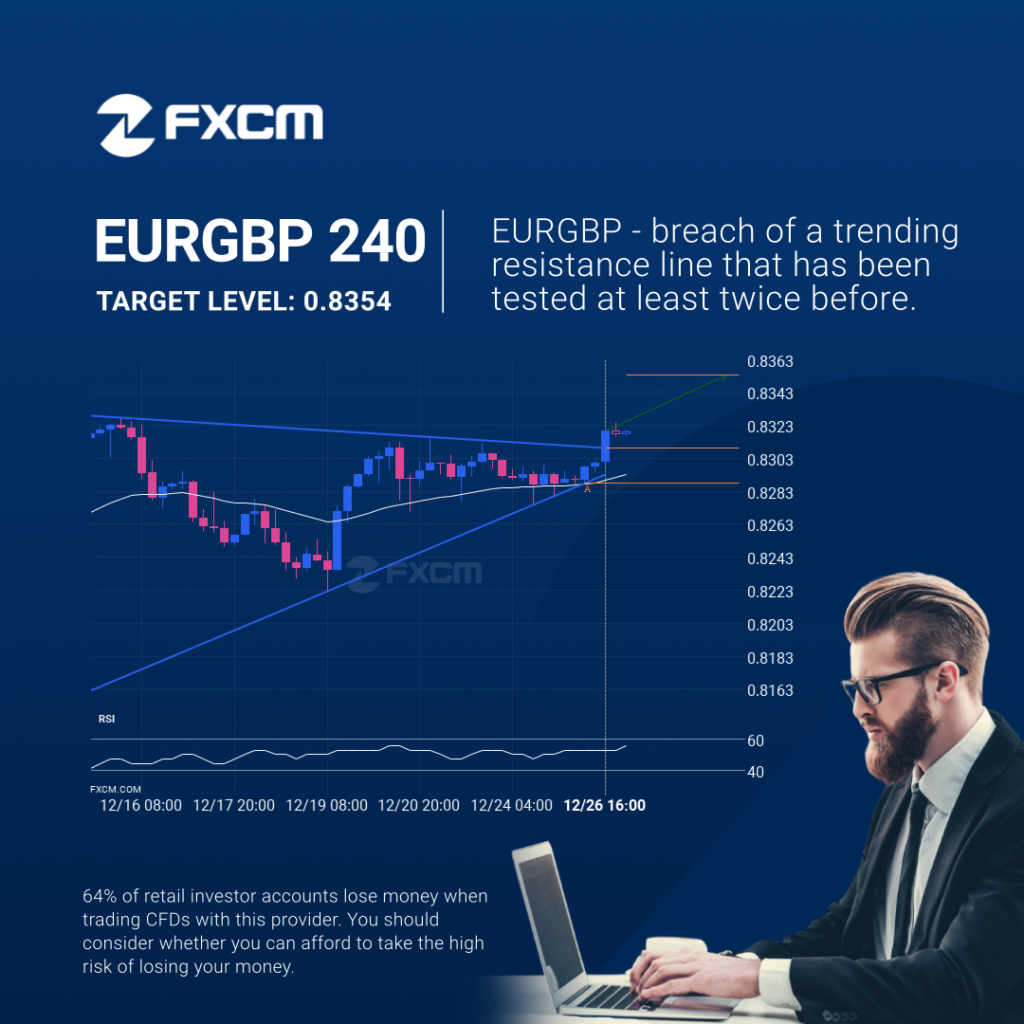
EURGBP moved through the resistance line of a Triangle at 0.8309156666666668 on the 4 hour chart. This line has been tested a number of times in the past and this breakout could mean an upcoming change from the current trend. It may continue in its current direction toward 0.8354. Past performance is not an indicator […]