HKG33 se acerca a un nivel importante en 19970.0293
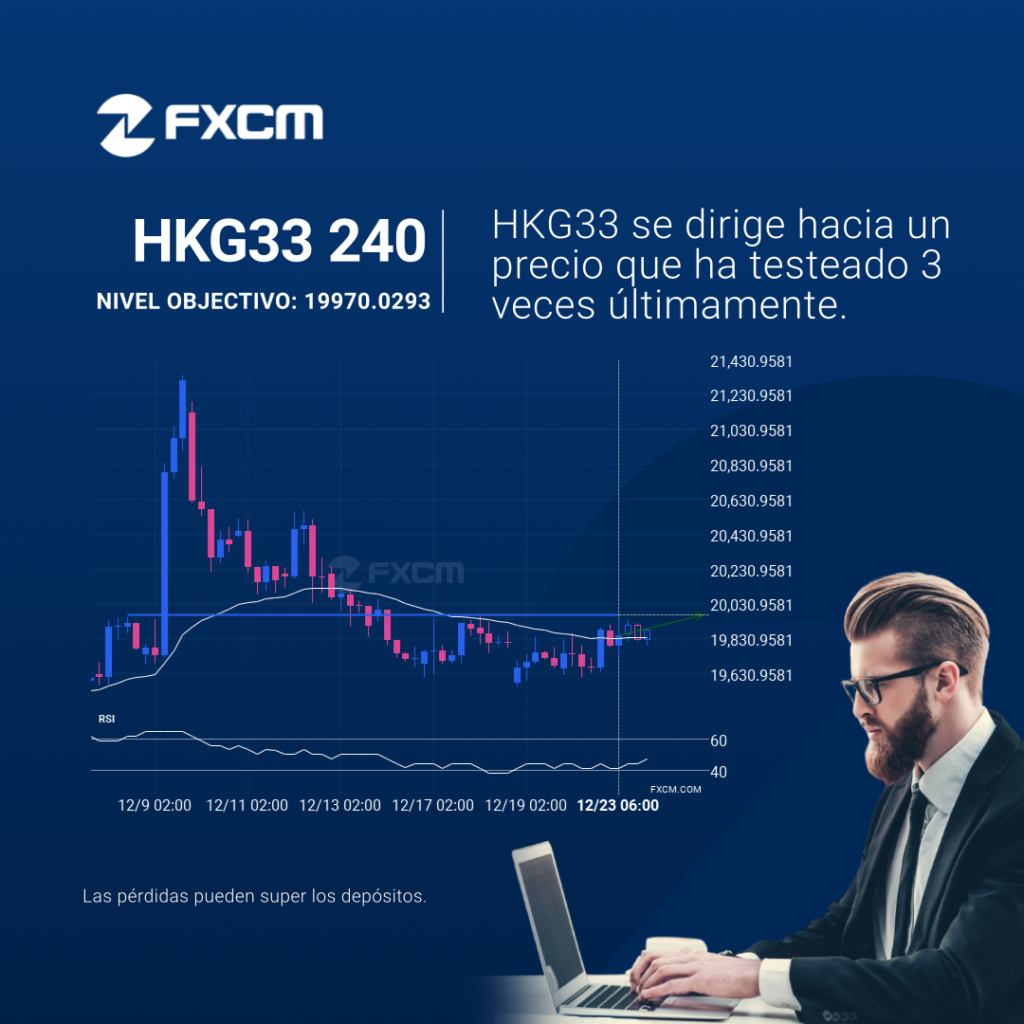
El HKG33 avanza hacia la línea de resistencia de un Resistencia. Como lo hemos observado retrocediendo desde este nivel en el pasado, podríamos observar, o bien una ruptura a través de esta línea o una recuperación de nuevo a los niveles actuales. Ya ha llegado a dicha línea en numerosas ocasiones durante los últimos 17 […]
USDCAD was on its way up
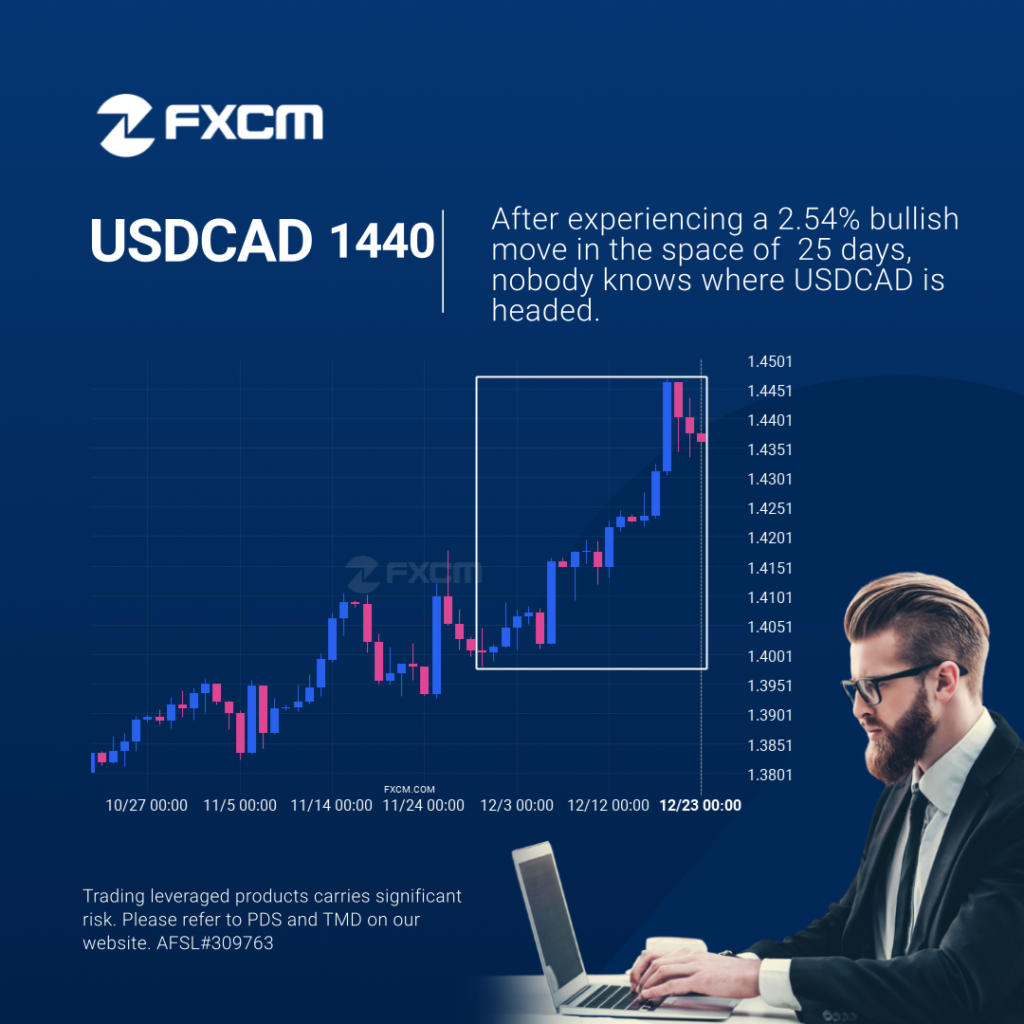
An unexpected large move has occurred on USDCAD Daily chart beginning at 1.40045 and ending at 1.43604. Is this a sign of something new? What can we expect in the future? Past performance is not an indicator of future results. Trading leveraged products carries significant risk. Please refer to PDS and TMD on our website. […]
HKG33 approaching important level of 19970.0293
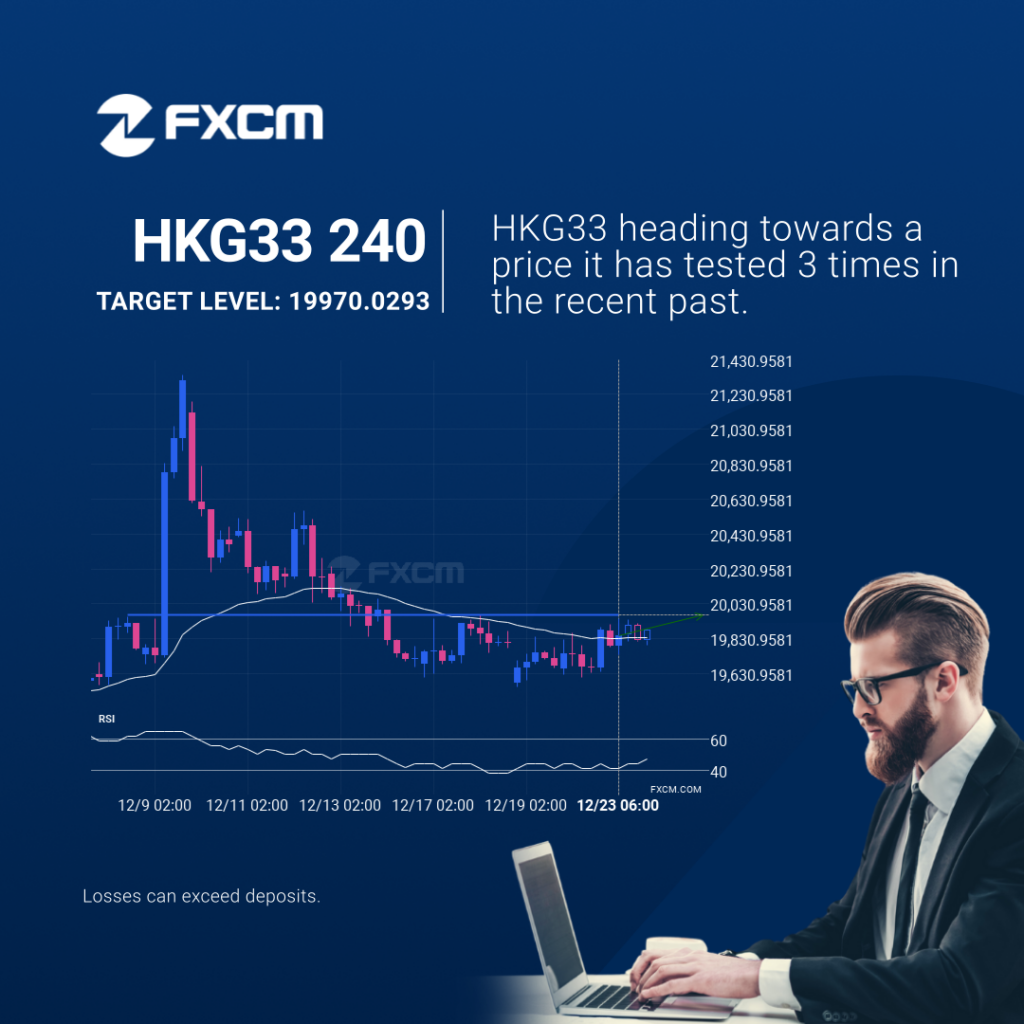
HKG33 is moving towards a resistance line. Because we have seen it retrace from this level in the past, we could see either a break through this line, or a rebound back to current levels. It has touched this line numerous times in the last 17 days and may test it again within the next […]
HKG33 approaching important level of 19970.0293
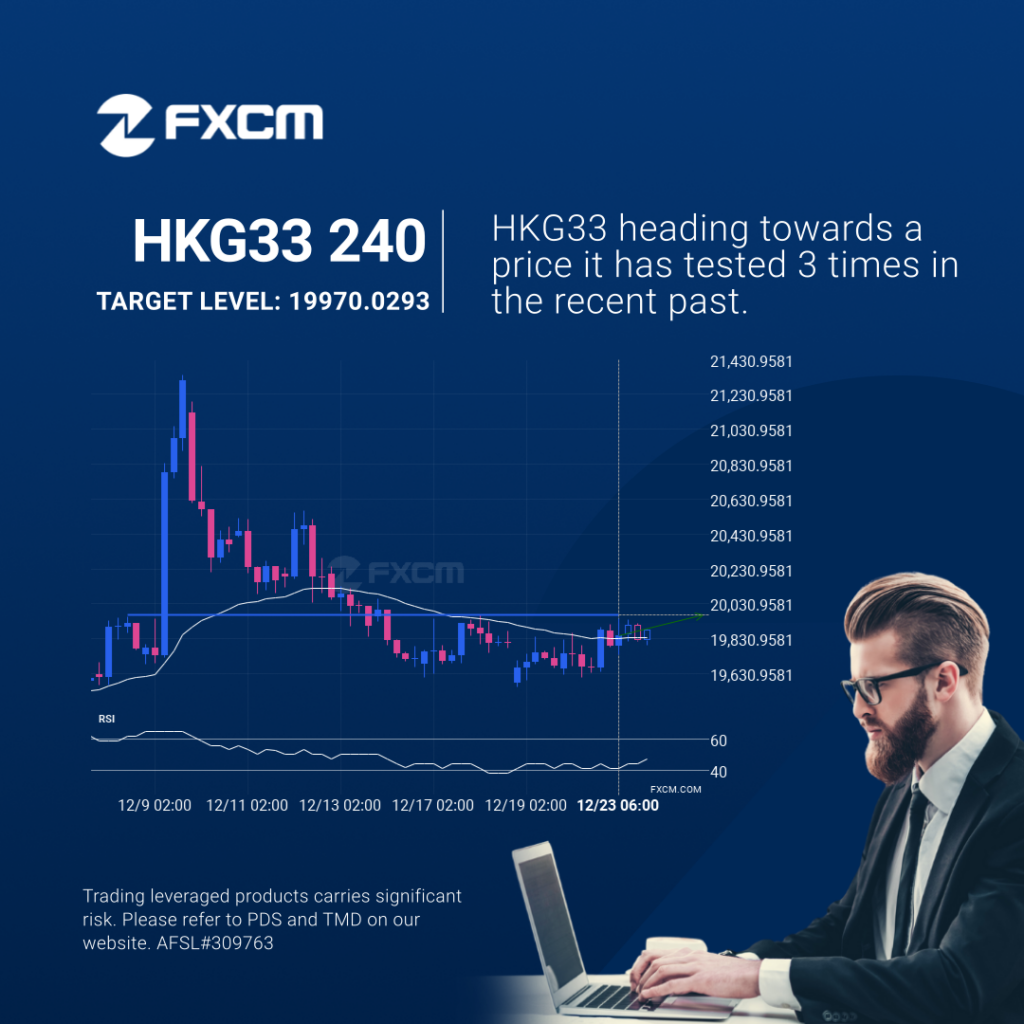
HKG33 is moving towards a resistance line. Because we have seen it retrace from this level in the past, we could see either a break through this line, or a rebound back to current levels. It has touched this line numerous times in the last 17 days and may test it again within the next […]
HKG33 approaching important level of 19970.0293
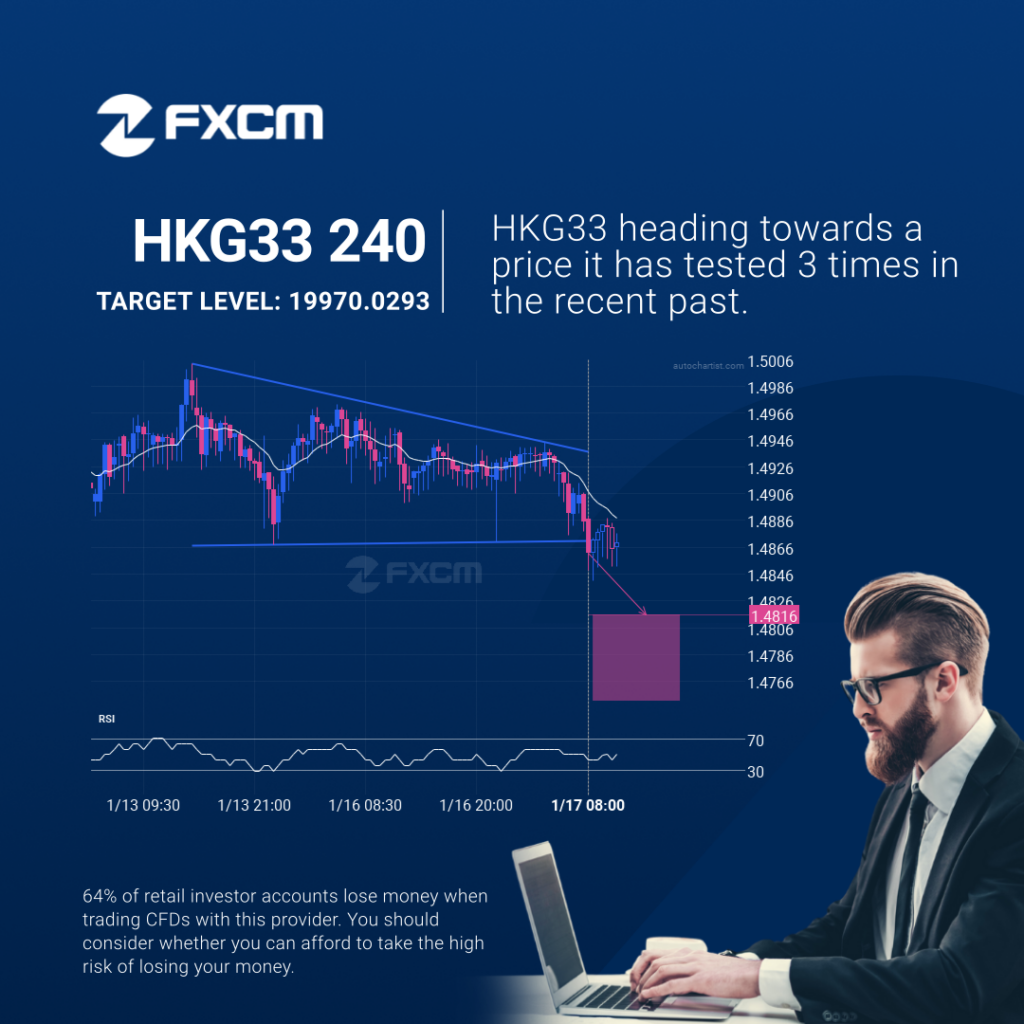
HKG33 is moving towards a resistance line. Because we have seen it retrace from this level in the past, we could see either a break through this line, or a rebound back to current levels. It has touched this line numerous times in the last 17 days and may test it again within the next […]
USDCAD was on its way up
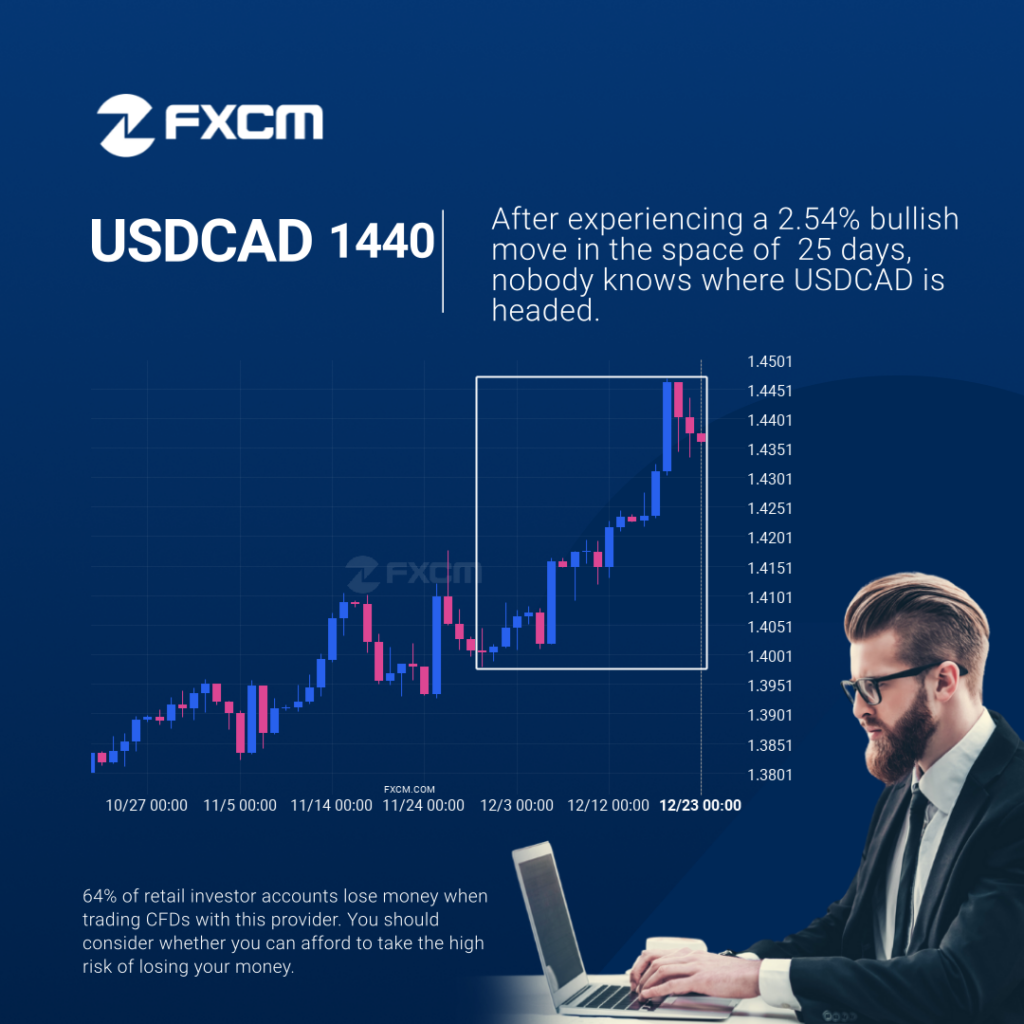
An unexpected large move has occurred on USDCAD Daily chart beginning at 1.40045 and ending at 1.43604. Is this a sign of something new? What can we expect in the future? Past performance is not an indicator of future results. 64% of retail investor accounts lose money when trading CFDs with this provider. You should […]
USDCAD fue hacia arriba
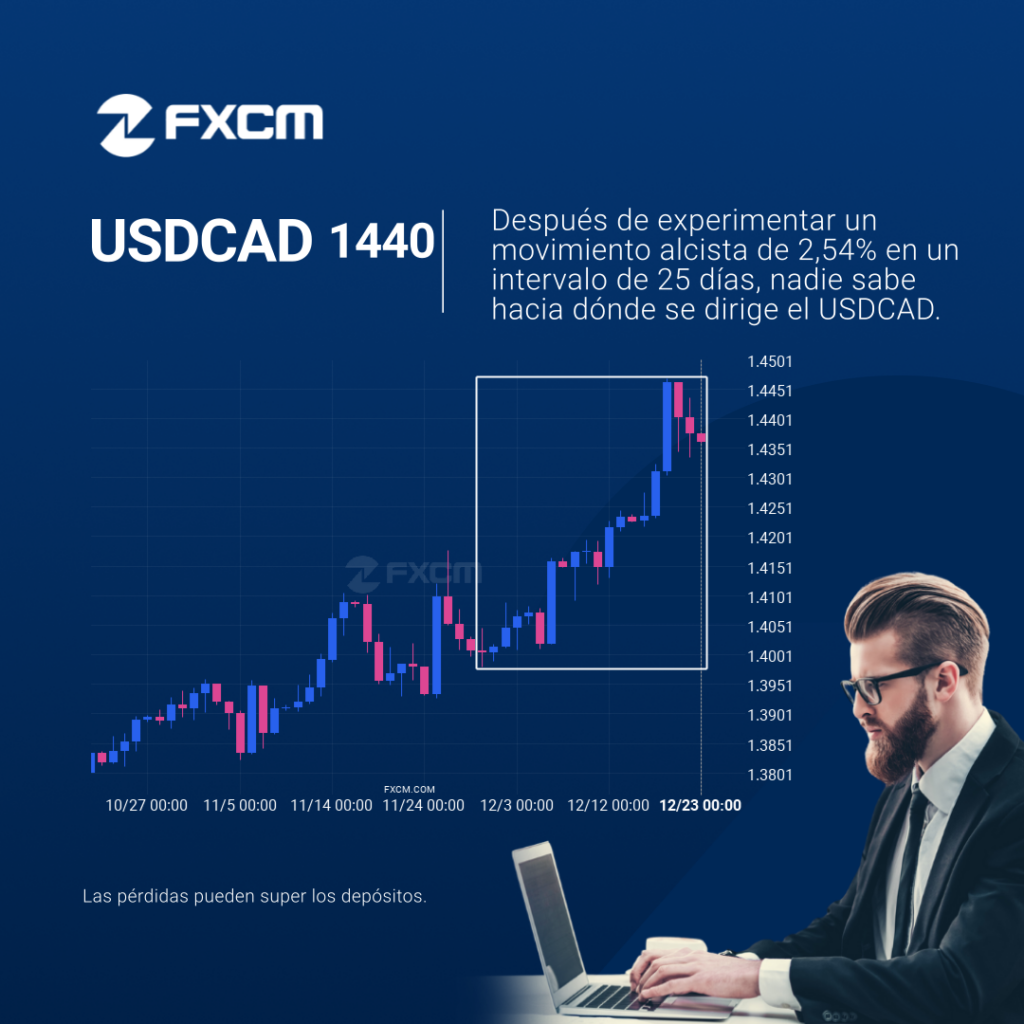
Se ha producido un gran movimiento inesperado en el gráfico de Diario de USDCAD que comienza en 1.40045 y finaliza en 1.43604. ¿Es esto una señal de algo nuevo? ¿Qué podemos esperar en el futuro? El rendimiento pasado no es indicativo de resultados futuros. Las pérdidas pueden exceder los fondos depositados.
Inminente recuperación o irrupción del ESP35
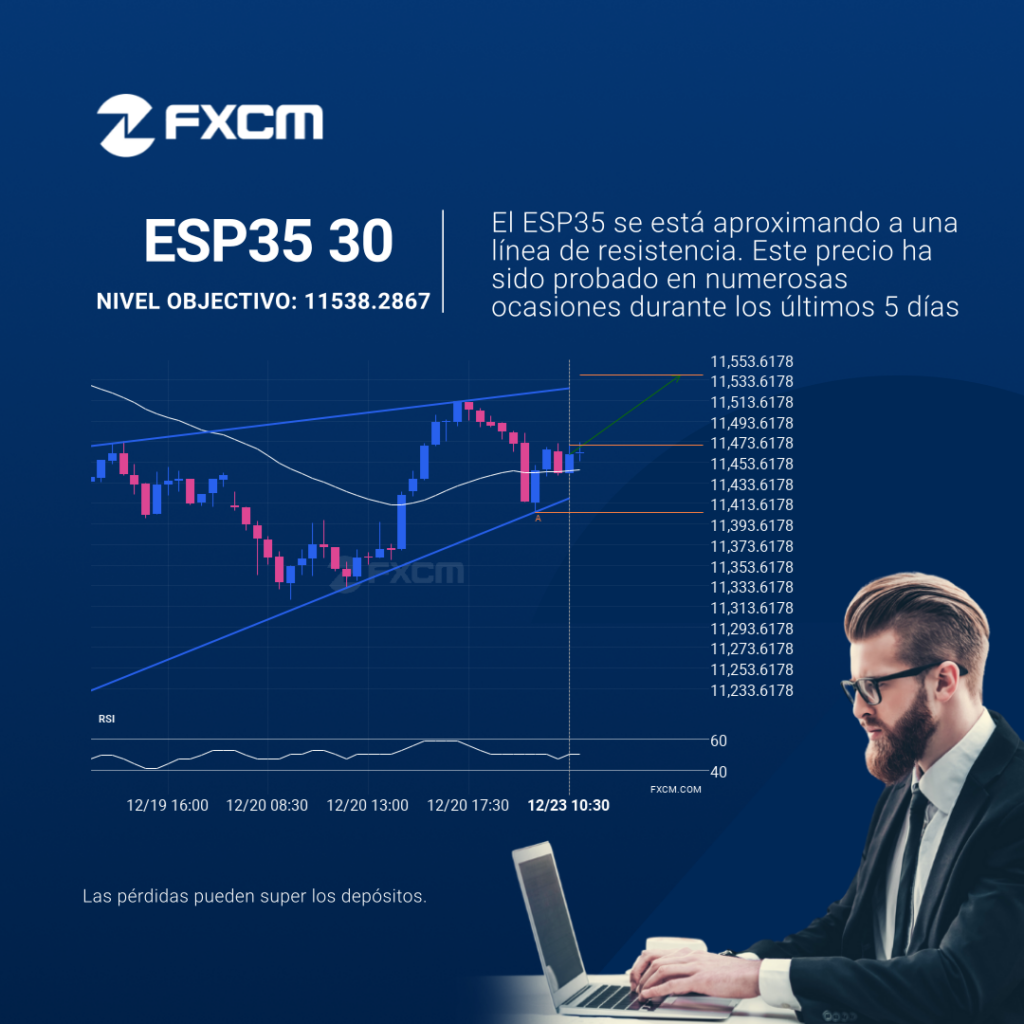
El patrón de Cuña ascendente emergente en su ola final se identificó en el gráfico de 30 Minutos de ESP35. Después de un fuerte movimiento alcista, encontramos que ESP35 se dirige hacia la línea del triángulo superior con una posible resistencia en 11538.2867. Si resulta que el nivel de resistencia aguanta, el patrón de Cuña […]
Extreme movement on AUDUSD
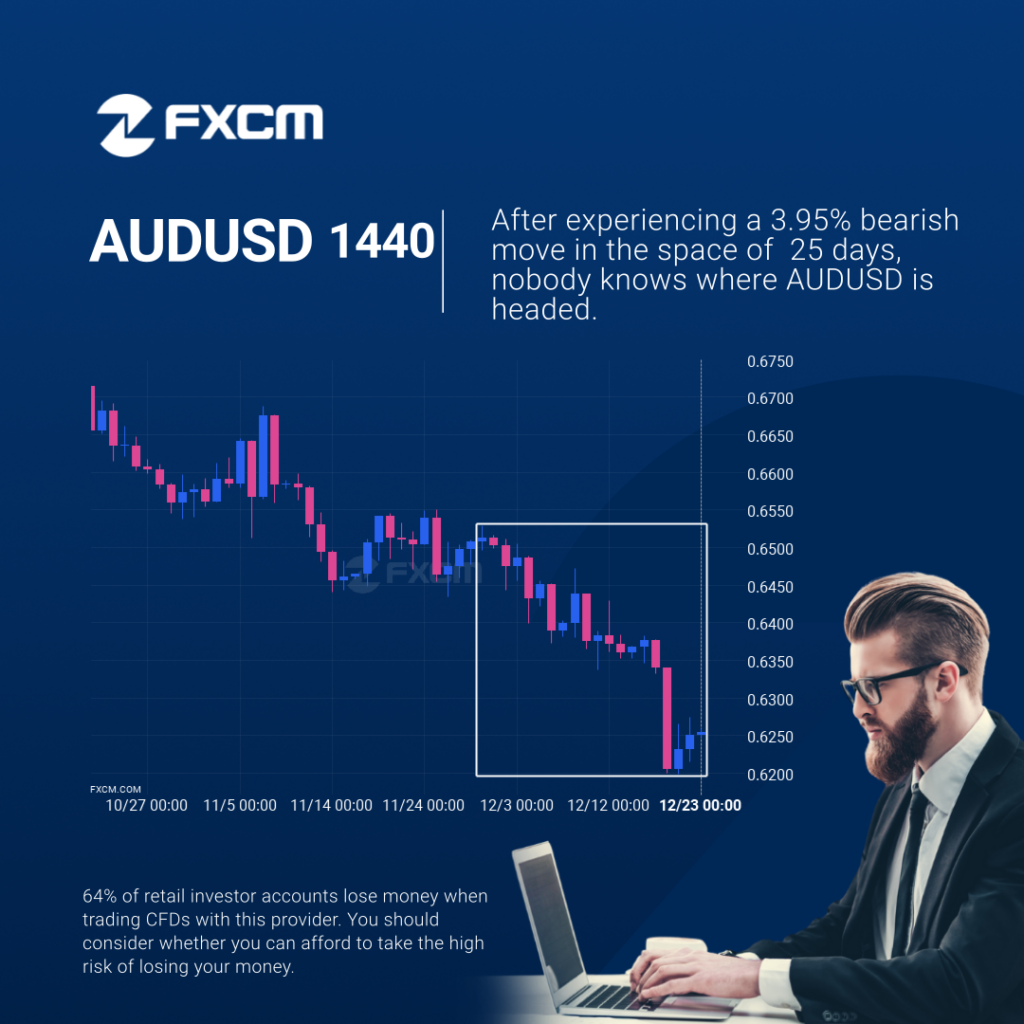
AUDUSD hits 0.62546 after a 3.95% move spanning 25 days. Past performance is not an indicator of future results. 64% of retail investor accounts lose money when trading CFDs with this provider. You should consider whether you can afford to take the high risk of losing your money.
Movimiento extremo en AUDUSD
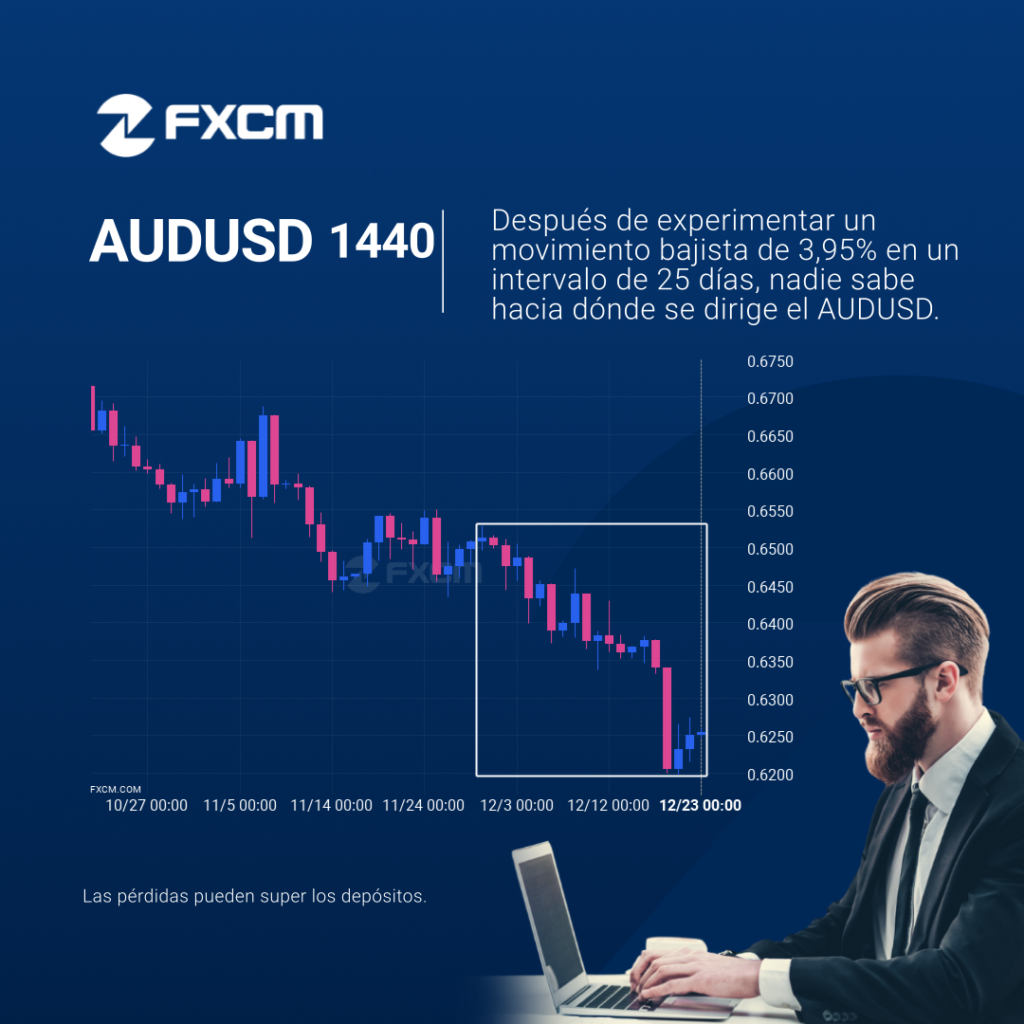
AUDUSD llegó a 0.62546 después de un movimiento del 3,95% que ha durado 25 días. El rendimiento pasado no es indicativo de resultados futuros. Las pérdidas pueden exceder los fondos depositados.