Either a rebound or a breakout imminent on EURJPY

EURJPY is moving towards a key resistance level at 161.7170. This is a previously tested level for EURJPY. This could be a good trading opportunity, either at the spot price, or after breaching this level. Past performance is not an indicator of future results. Losses can exceed deposits.
Extreme movement on NZDUSD

Those of you that are trend followers are probably eagerly watching NZDUSD to see if its latest 1.64% move continues. If not, the mean-reversion people out there will be delighted with this exceptionally large 2 days move. Past performance is not an indicator of future results. Losses can exceed deposits.
Where is EURCHF moving to?

Those of you that are trend followers are probably eagerly watching EURCHF to see if its latest 0.47% move continues. If not, the mean-reversion people out there will be delighted with this exceptionally large 12 hours move. Past performance is not an indicator of future results. Losses can exceed deposits.
A potential bearish movement on AUDUSD

AUDUSD is moving towards a support line. Because we have seen it retrace from this line before, we could see either a break through this line, or a rebound back to current levels. It has touched this line numerous times in the last 2 days and may test it again within the next 5 hours. […]
EURGBP – support line broken at 2024-12-17T10:00:00.000Z
EURGBP has breached the support line at 0.8270. It may continue the bearish trend towards 0.8234, or, it may prove to be yet another test of this level. Past performance is not an indicator of future results. Losses can exceed deposits.
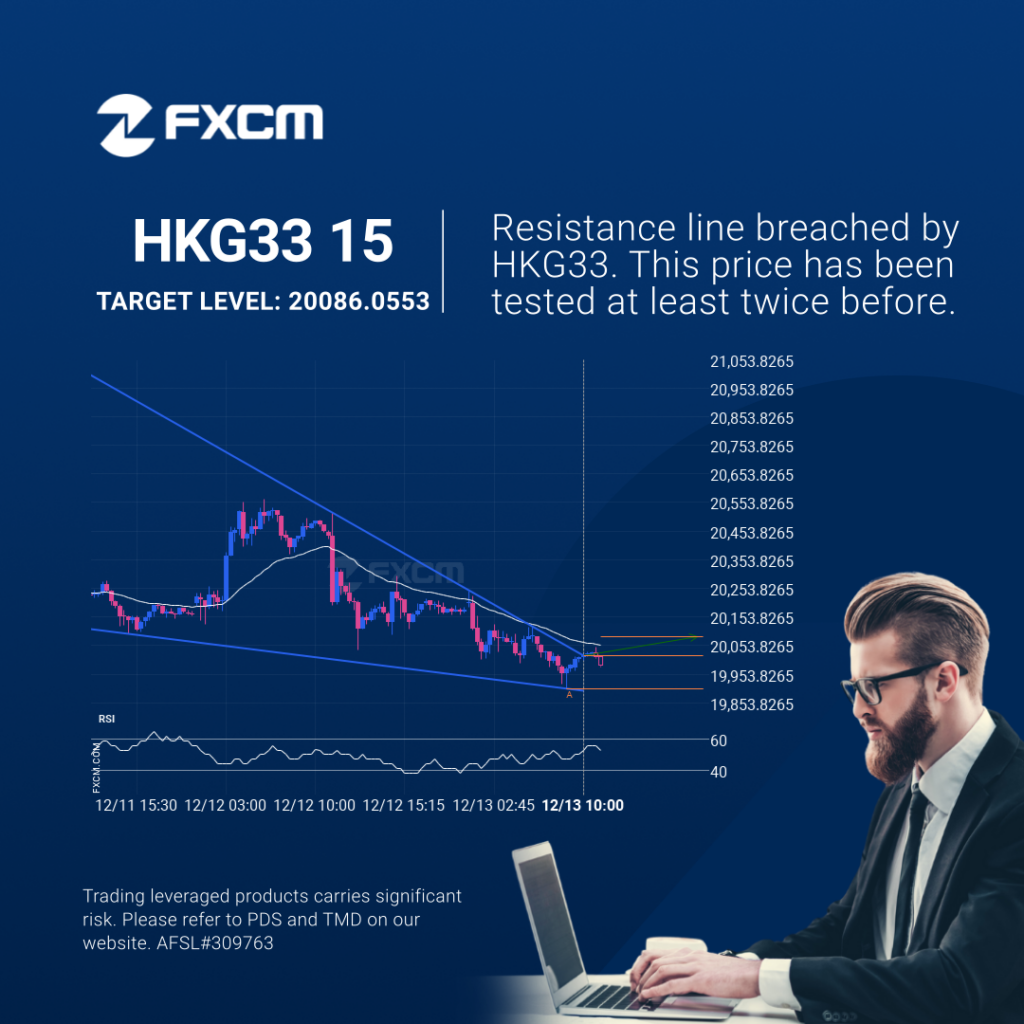
Resistance line breached by HKG33

HKG33 has broken through a resistance line of a Falling Wedge chart pattern. If this breakout holds true, we may see the price of HKG33 testing 20086.0553 within the next 8 hours. But don’t be so quick to trade, it has tested this line in the past, so you should confirm the breakout before taking […]