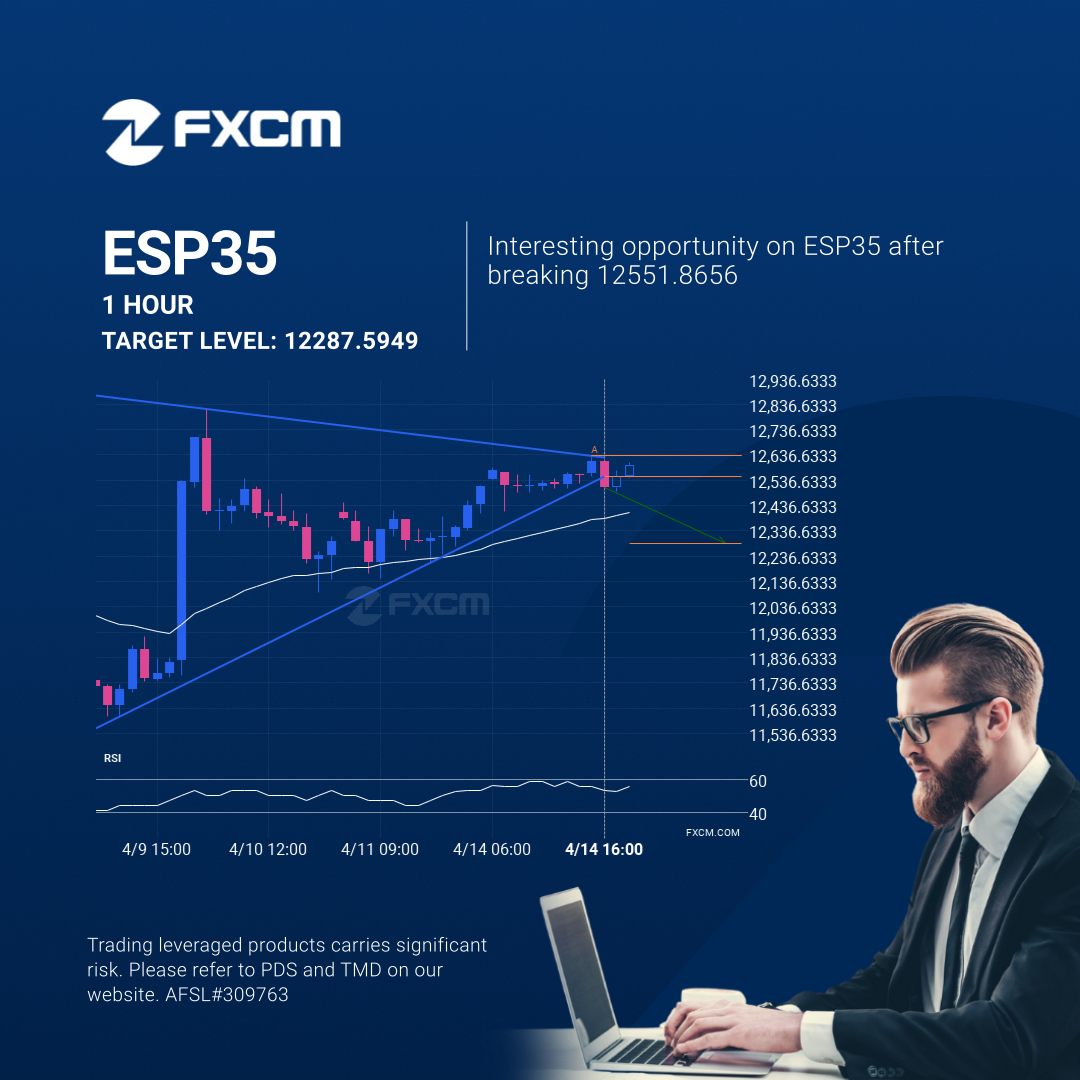
ESP35 moved through the support line of a Triangle at 12551.8656 on the 1 hour chart. This line has been tested a number of times in the past and this breakout could mean an upcoming change from the current trend. It may continue in its current direction toward 12287.5949.
Past performance is not an indicator of future results.
Trading leveraged products carries significant risk. Please refer to PDS and TMD on our website. AFSL#309763