Technical Analysis Indices
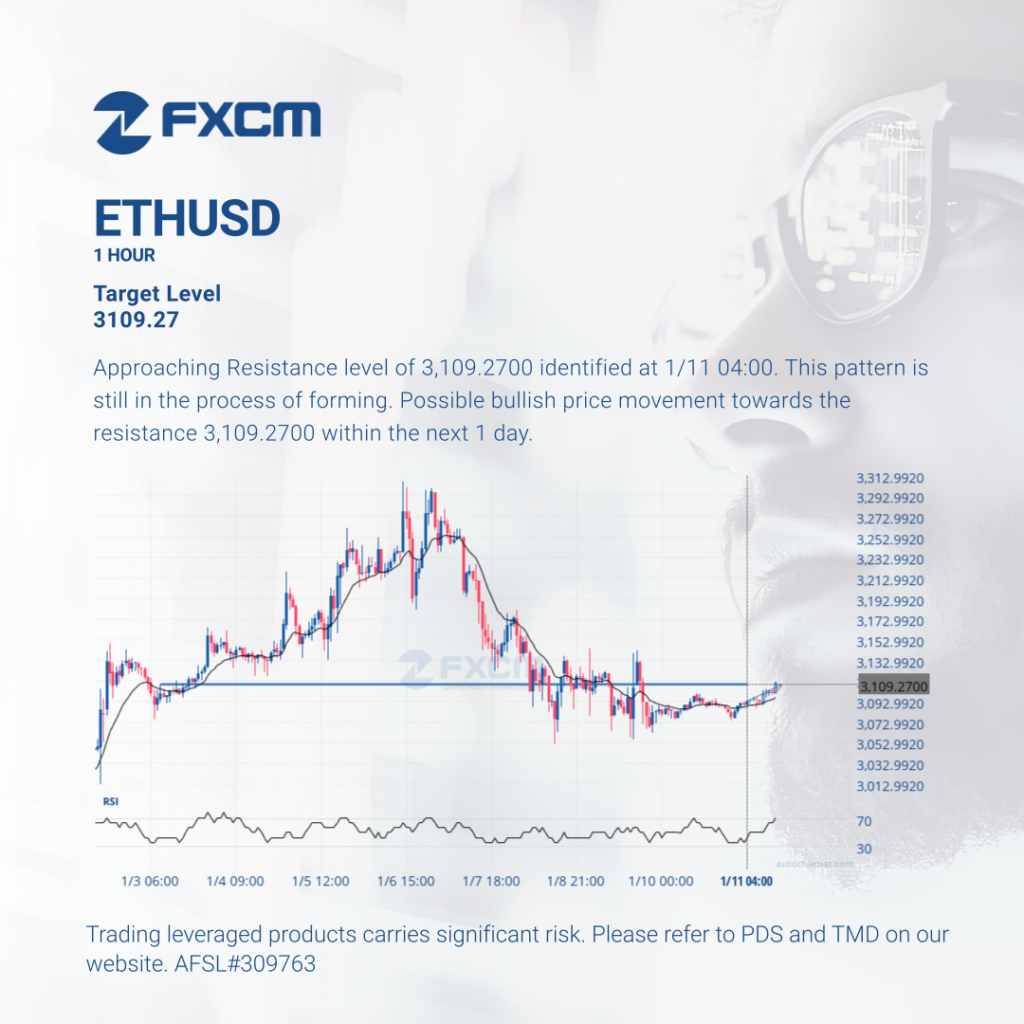
Approaching Resistance level of 3,109.2700 identified at 1/11 04:00. This pattern is still in the process of forming. Possible bullish price movement towards the resistance 3,109.2700 within the next 1 day. Past performance is not an indicator of future results. Trading leveraged products carries significant risk. Please refer to PDS and TMD on our website. […]
Technical Analysis Indices
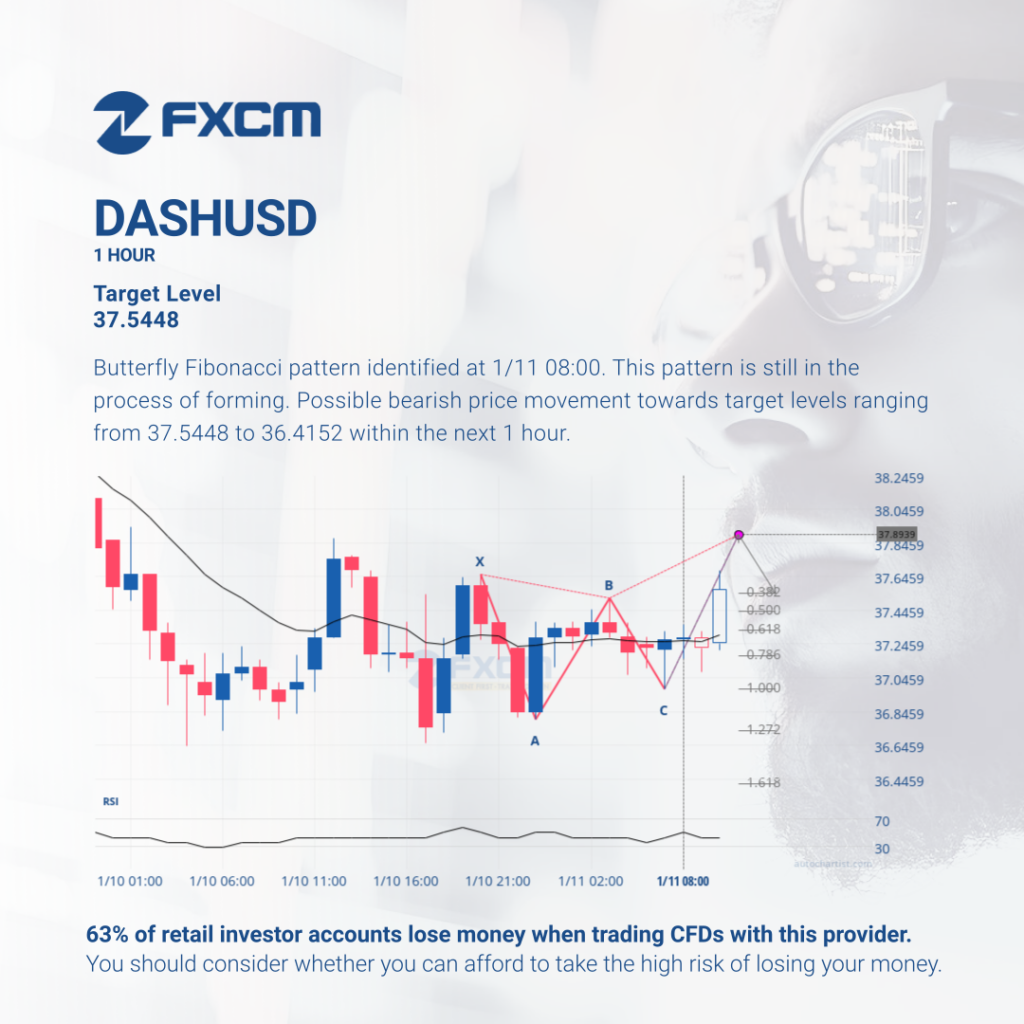
Butterfly Fibonacci pattern identified at 1/11 08:00. This pattern is still in the process of forming. Possible bearish price movement towards target levels ranging from 37.5448 to 36.4152 within the next 1 hour. Past performance is not an indicator of future results. Losses can exceed deposits.
Technical Analysis Indices
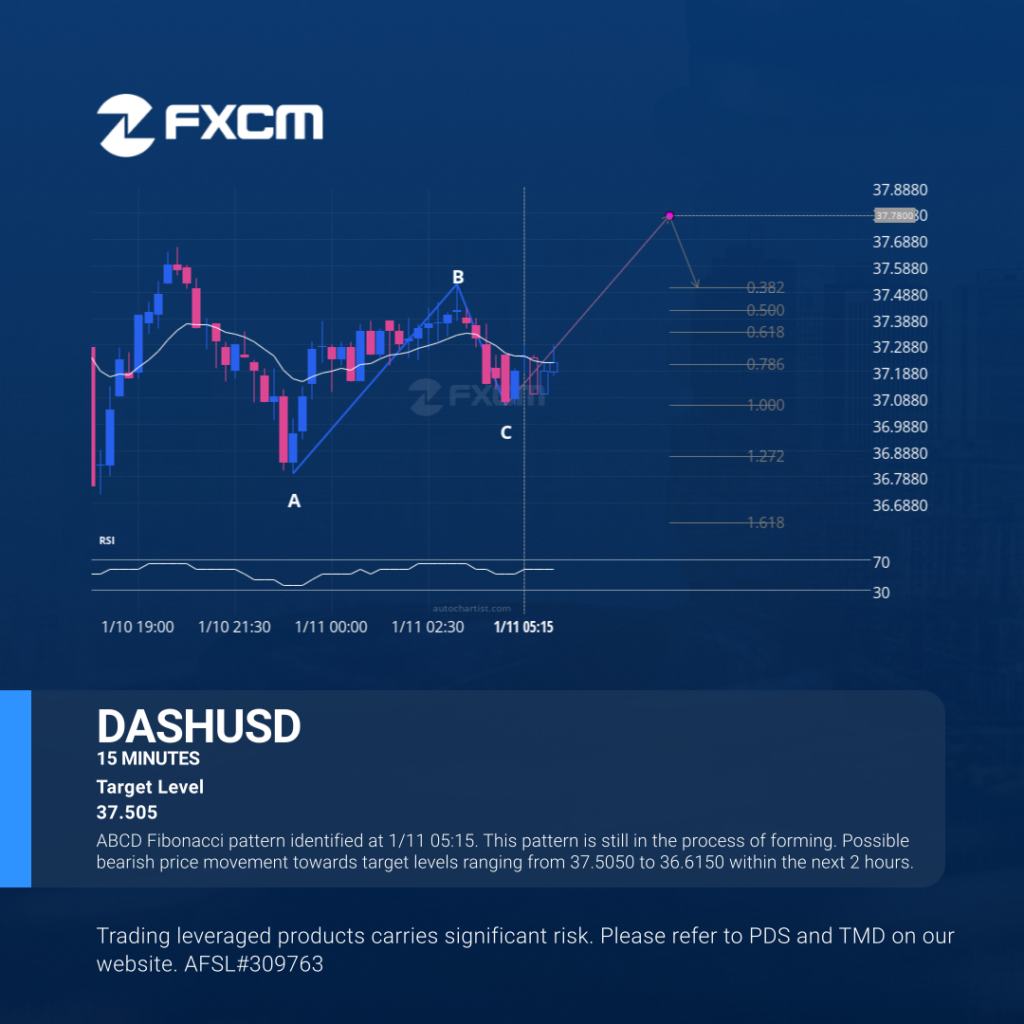
ABCD Fibonacci pattern identified at 1/11 05:15. This pattern is still in the process of forming. Possible bearish price movement towards target levels ranging from 37.5050 to 36.6150 within the next 2 hours. Past performance is not an indicator of future results. Trading leveraged products carries significant risk. Please refer to PDS and TMD on […]
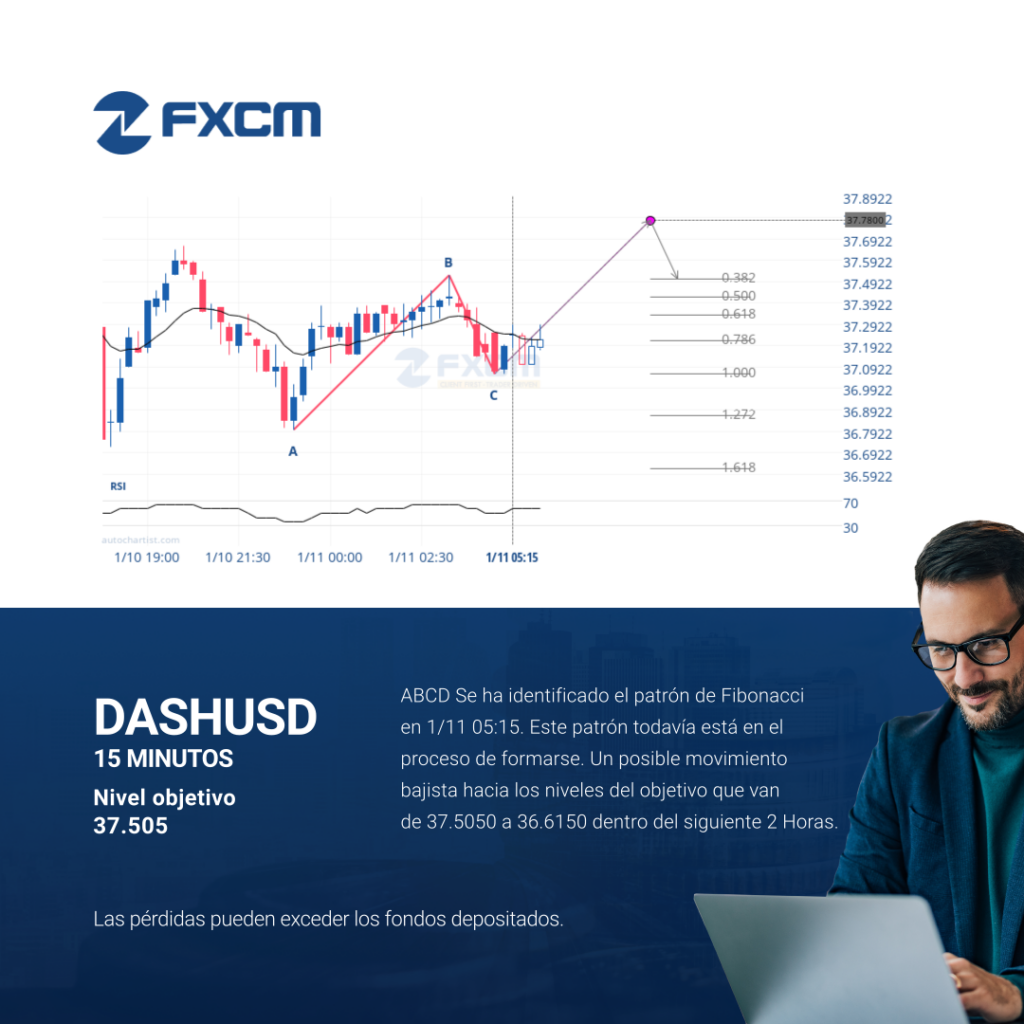
Análisis Técnico Cripto
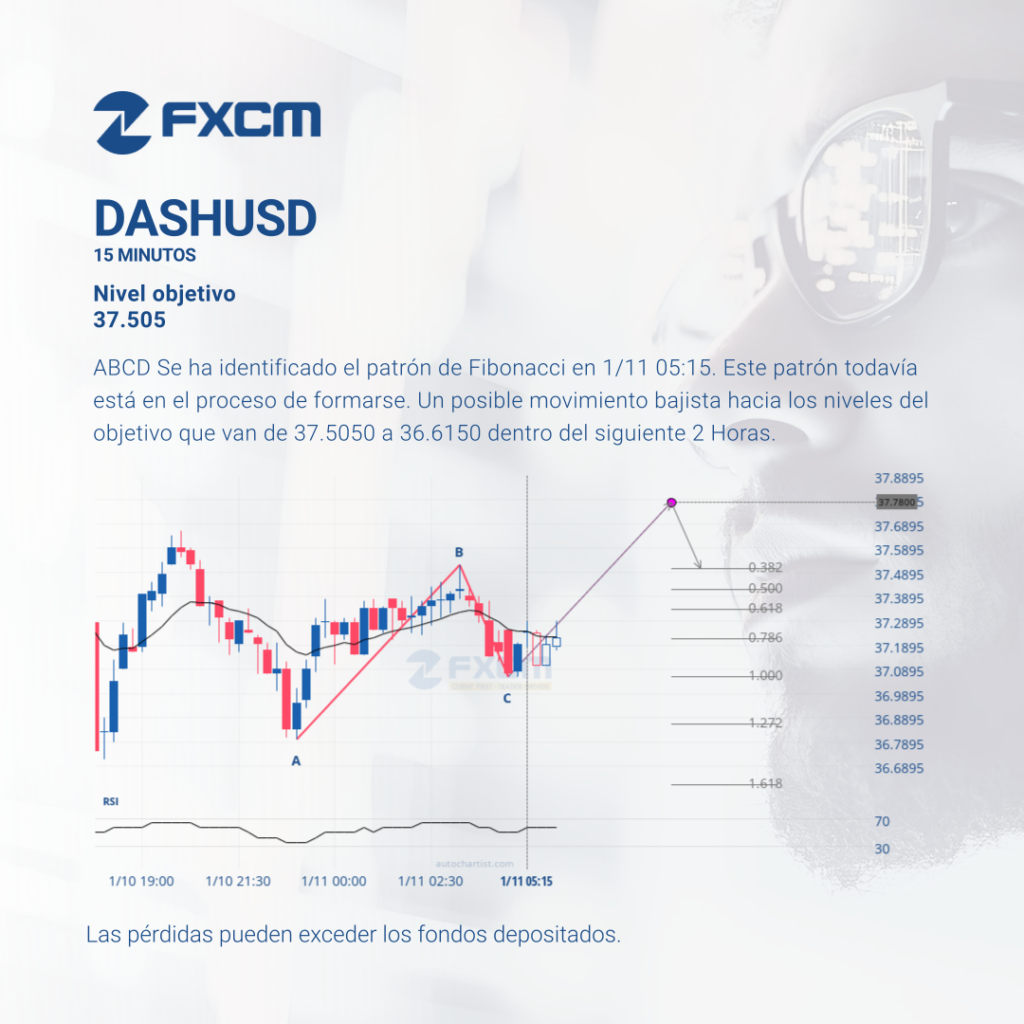
ABCD Se ha identificado el patrón de Fibonacci en 1/11 05:15. Este patrón todavía está en el proceso de formarse. Un posible movimiento bajista hacia los niveles del objetivo que van de 37.5050 a 36.6150 dentro del siguiente 2 Horas. El rendimiento pasado no es indicativo de resultados futuros. Las pérdidas pueden exceder los depósitos.
Índices de Análisis Técnico
ABCD Se ha identificado el patrón de Fibonacci en 1/11 05:15. Este patrón todavía está en el proceso de formarse. Un posible movimiento bajista hacia los niveles del objetivo que van de 37.5050 a 36.6150 dentro del siguiente 2 Horas. Las pérdidas pueden exceder los depósitos.
Technical Analysis Indices
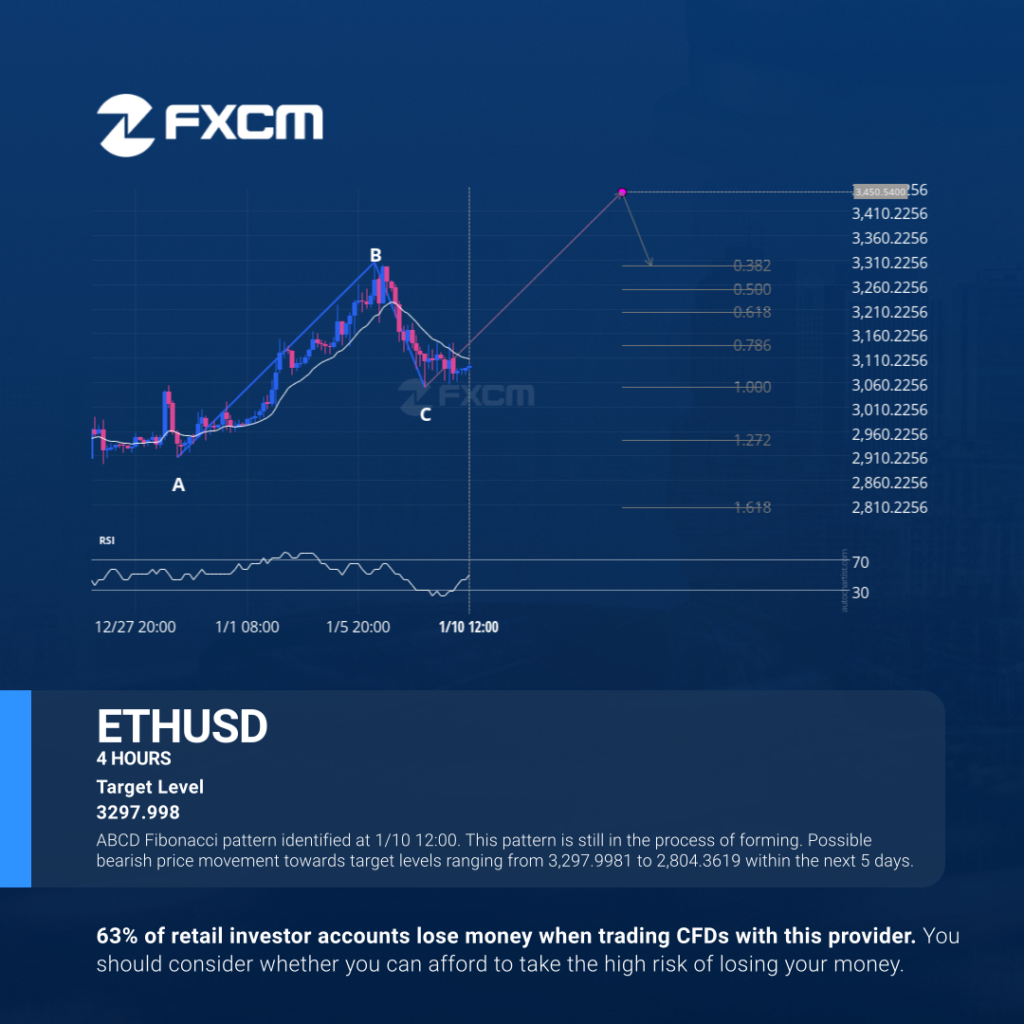
ABCD Fibonacci pattern identified at 1/10 12:00. This pattern is still in the process of forming. Possible bearish price movement towards target levels ranging from 3,297.9981 to 2,804.3619 within the next 5 days. Past performance is not an indicator of future results. Losses can exceed deposits.
Technical Analysis Indices
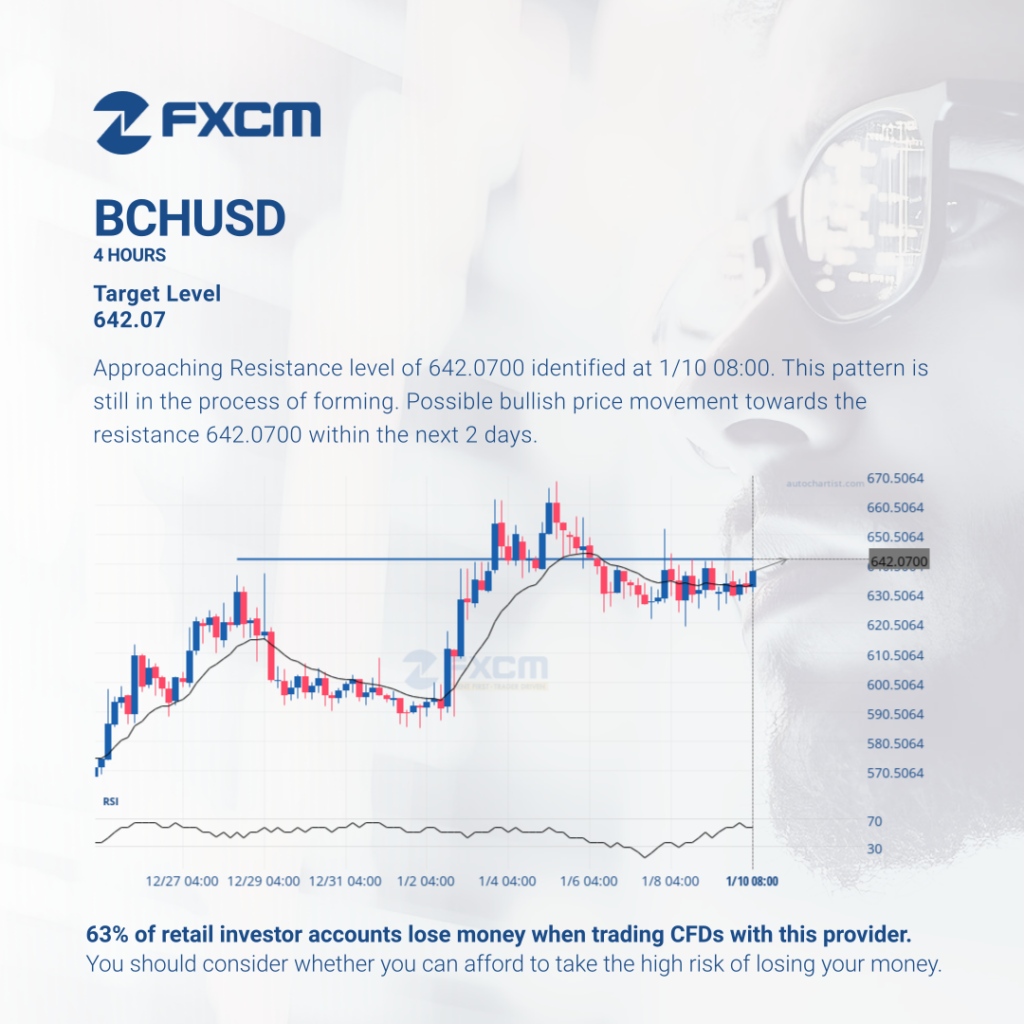
Approaching Resistance level of 642.0700 identified at 1/10 08:00. This pattern is still in the process of forming. Possible bullish price movement towards the resistance 642.0700 within the next 2 days. Past performance is not an indicator of future results. Losses can exceed deposits.
Índices de Análisis Técnico
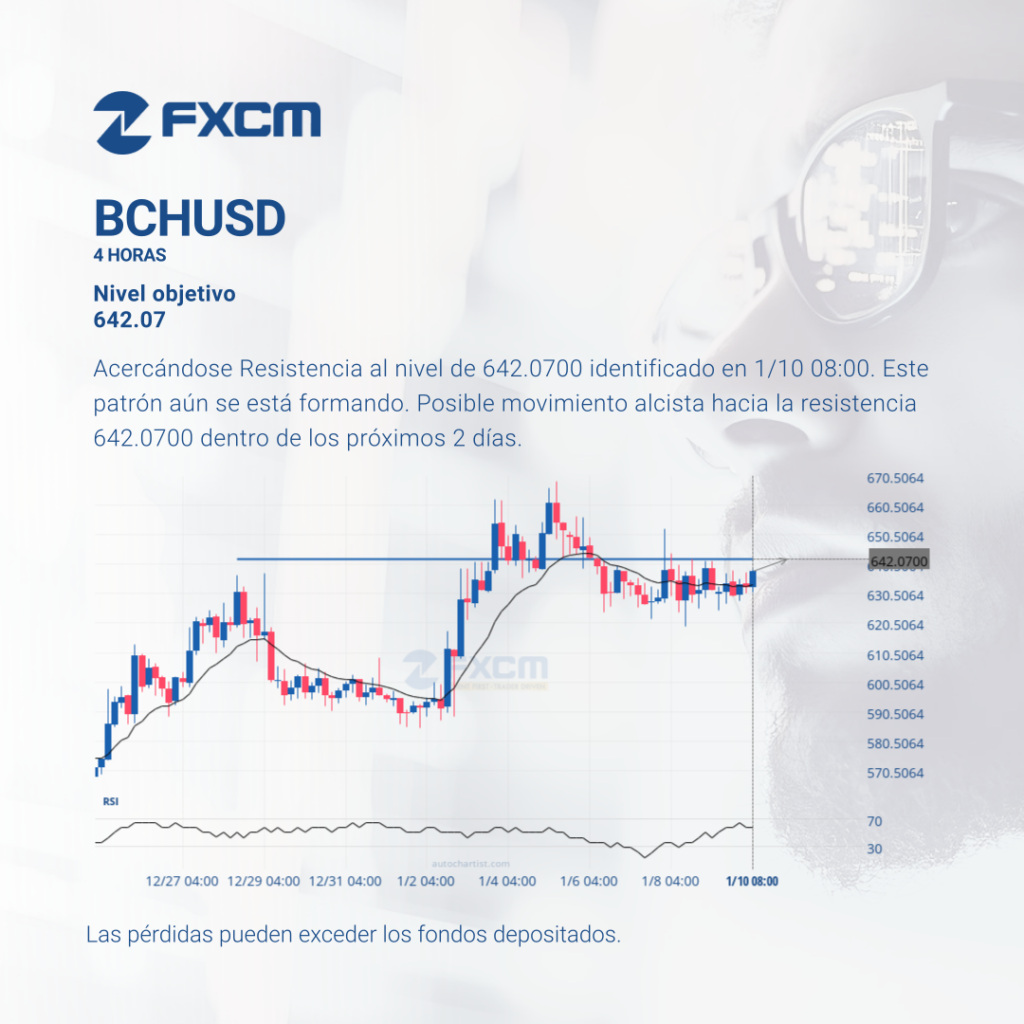
Acercándose Resistencia al nivel de 642.0700 identificado en 1/10 08:00. Este patrón aún se está formando. Posible movimiento alcista hacia la resistencia 642.0700 dentro de los próximos 2 días. Las pérdidas pueden exceder los depósitos.
Análisis Técnico Cripto
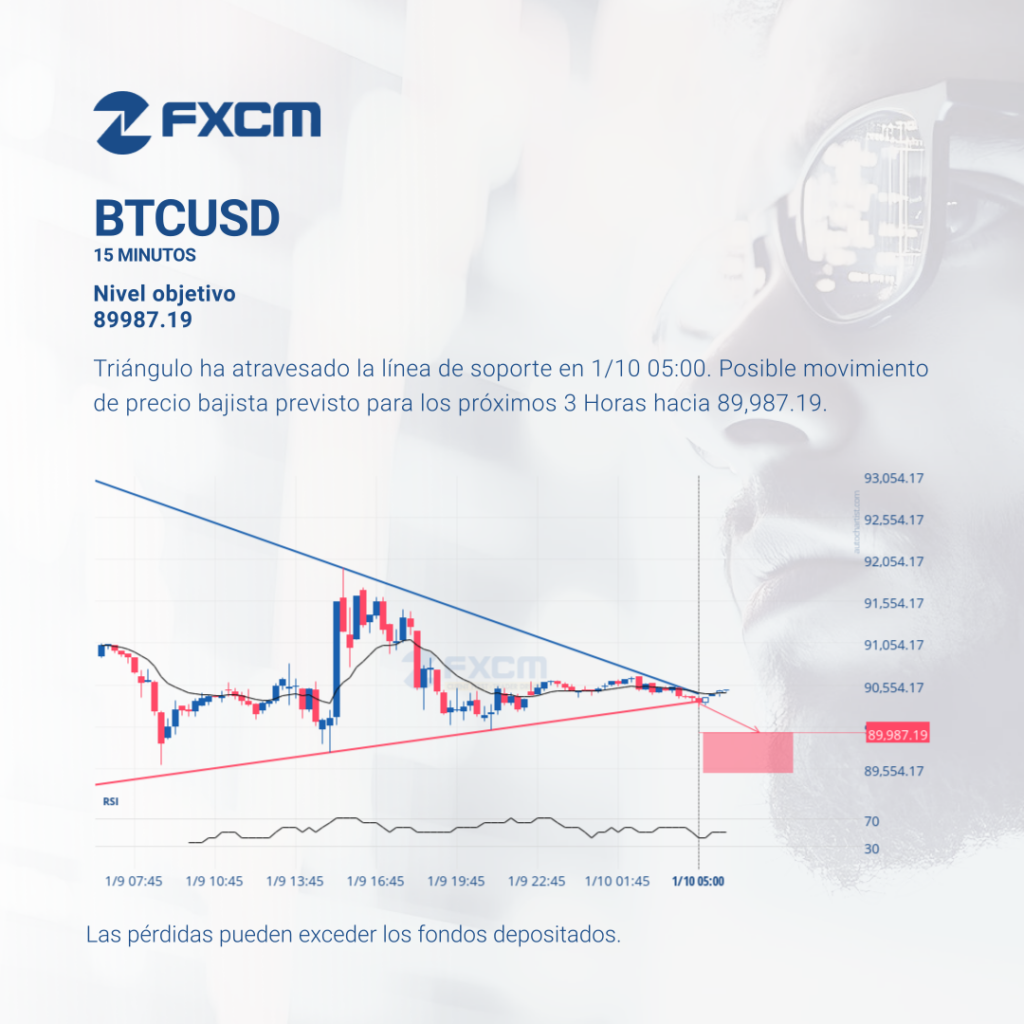
Triángulo ha atravesado la línea de soporte en 1/10 05:00. Posible movimiento de precio bajista previsto para los próximos 3 Horas hacia 89,987.19. El rendimiento pasado no es indicativo de resultados futuros. Las pérdidas pueden exceder los depósitos.
Technical Analysis Indices
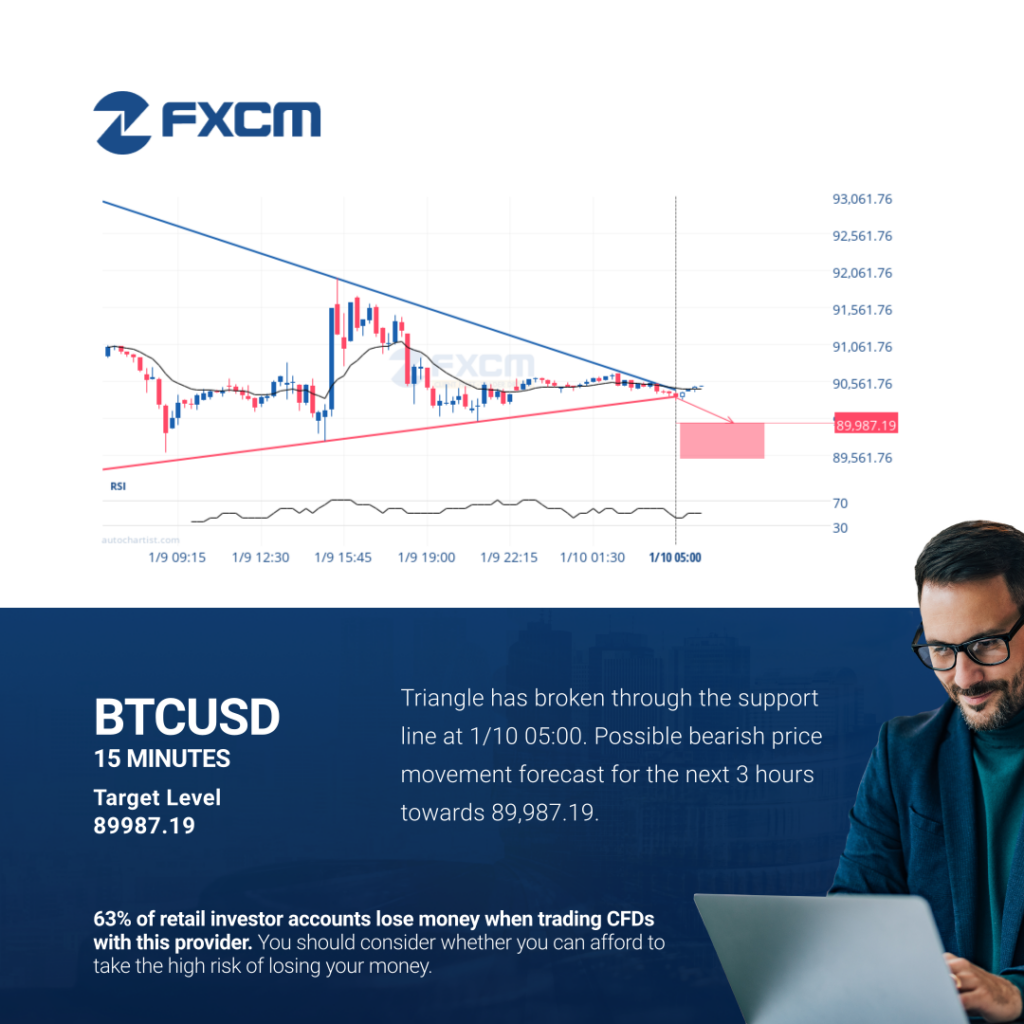
Triangle has broken through the support line at 1/10 05:00. Possible bearish price movement forecast for the next 3 hours towards 89,987.19. Past performance is not an indicator of future results. Losses can exceed deposits.