Technical Analysis Indices
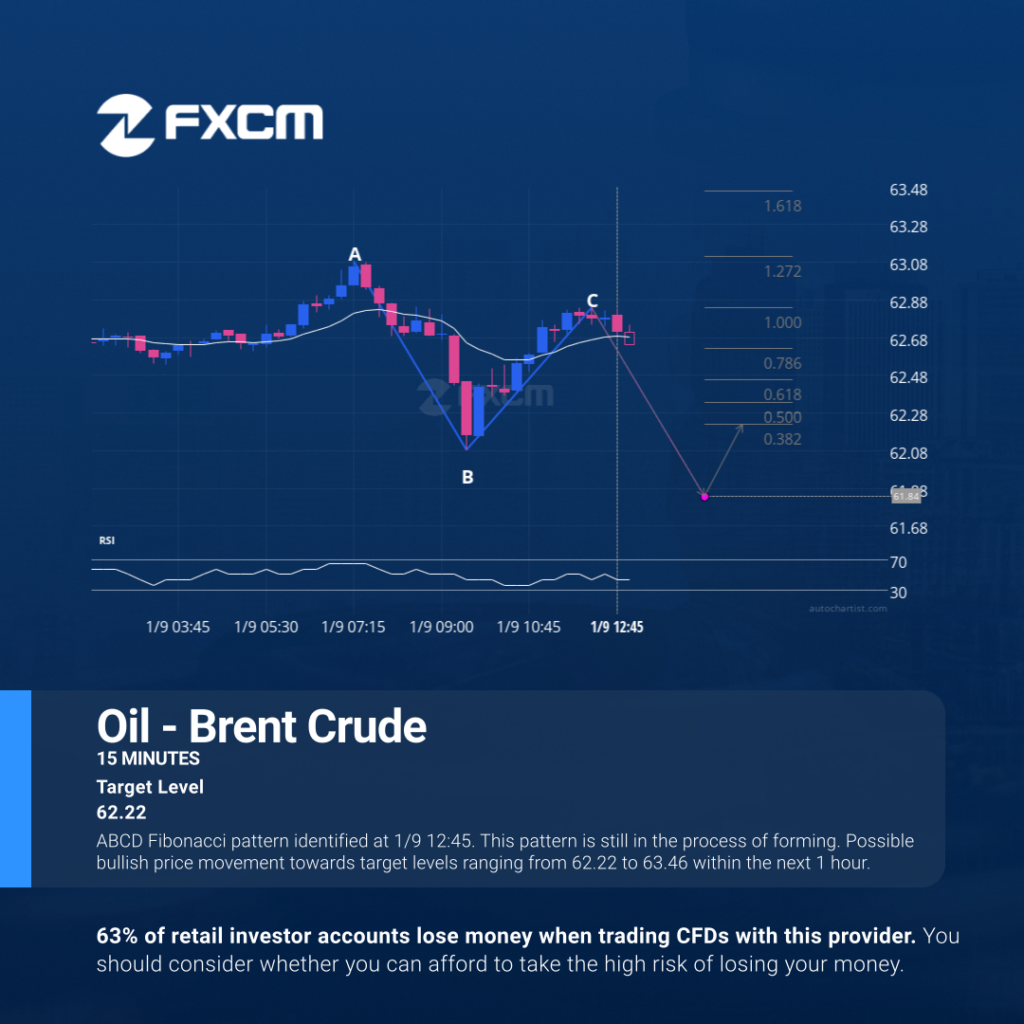
ABCD Fibonacci pattern identified at 1/9 12:45. This pattern is still in the process of forming. Possible bullish price movement towards target levels ranging from 62.22 to 63.46 within the next 1 hour. Past performance is not an indicator of future results. Losses can exceed deposits.
Análisis Técnico Cripto
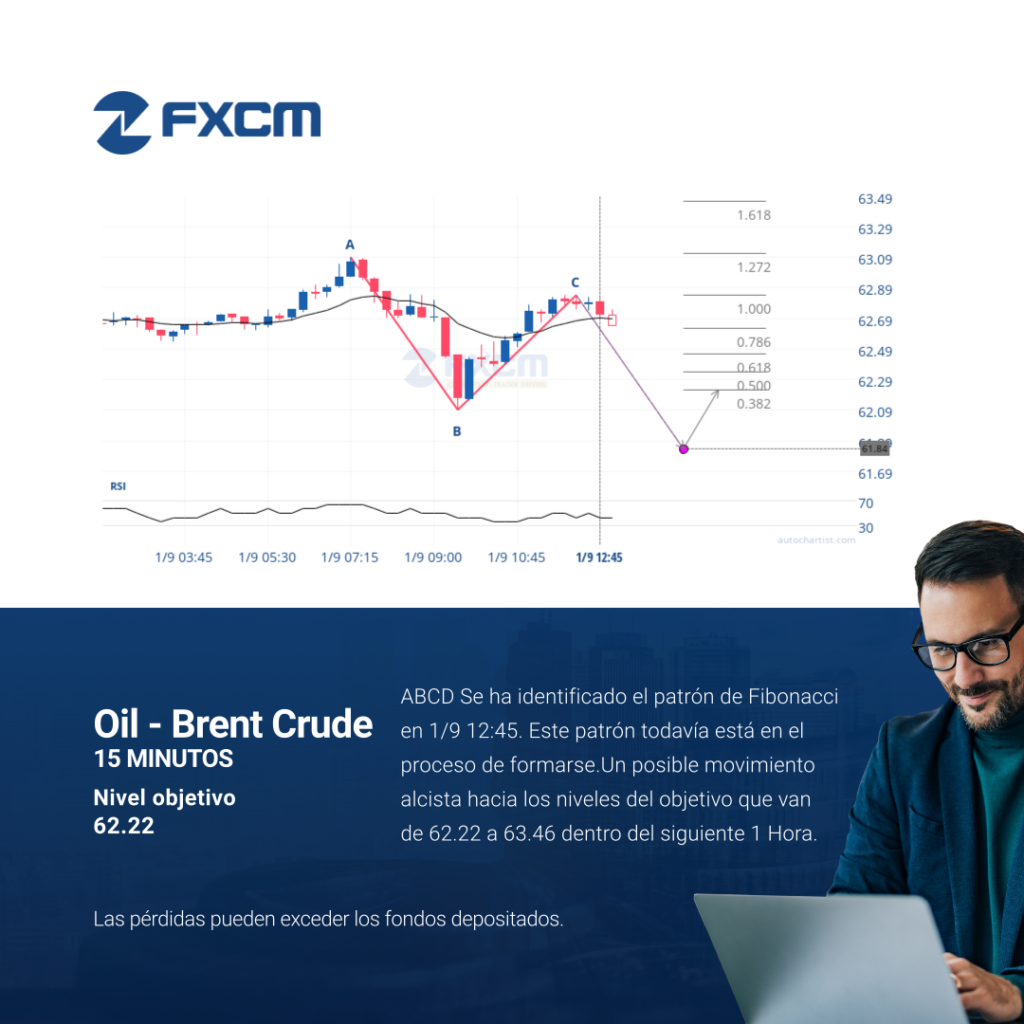
ABCD Se ha identificado el patrón de Fibonacci en 1/9 12:45. Este patrón todavía está en el proceso de formarse.Un posible movimiento alcista hacia los niveles del objetivo que van de 62.22 a 63.46 dentro del siguiente 1 Hora. El rendimiento pasado no es indicativo de resultados futuros. Las pérdidas pueden exceder los depósitos.
Technical Analysis Indices
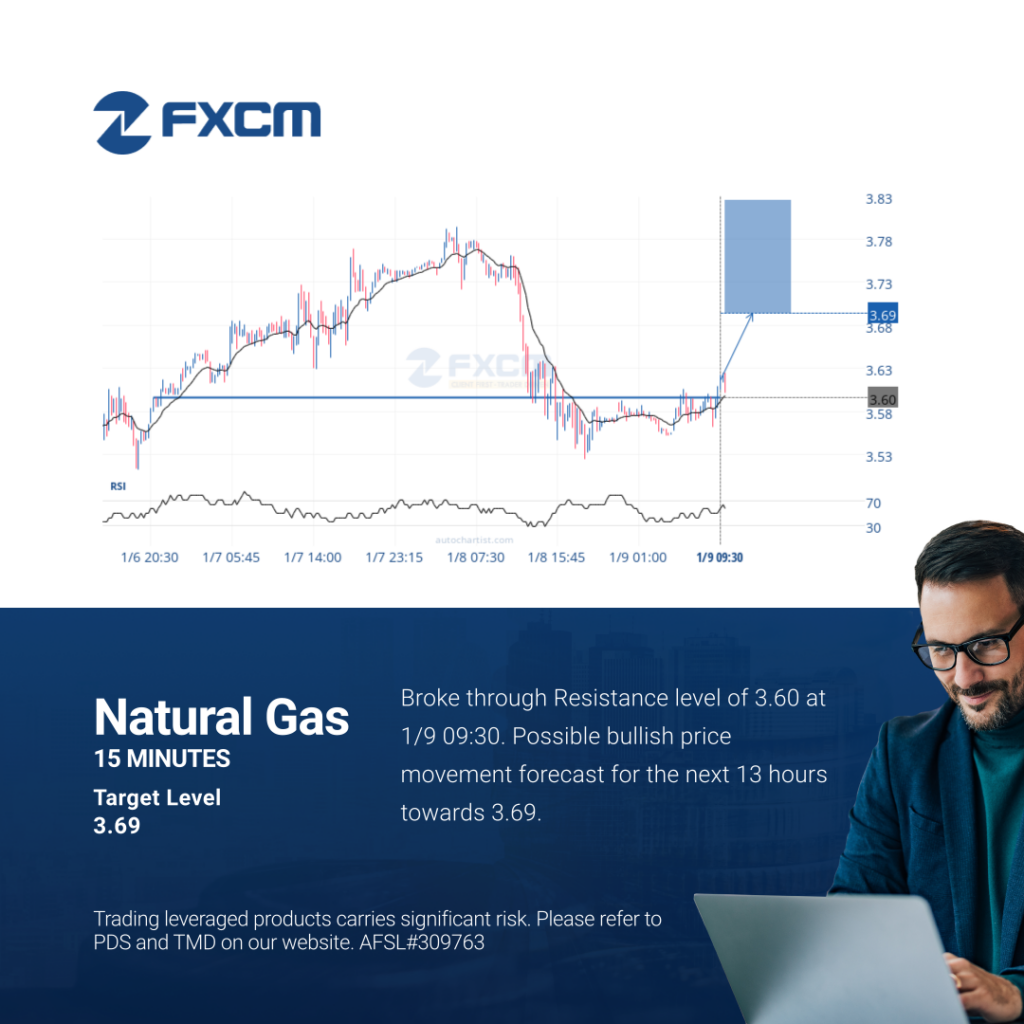
Broke through Resistance level of 3.60 at 1/9 09:30. Possible bullish price movement forecast for the next 13 hours towards 3.69. Past performance is not an indicator of future results. Trading leveraged products carries significant risk. Please refer to PDS and TMD on our website. AFSL#309763
Technical Analysis Indices
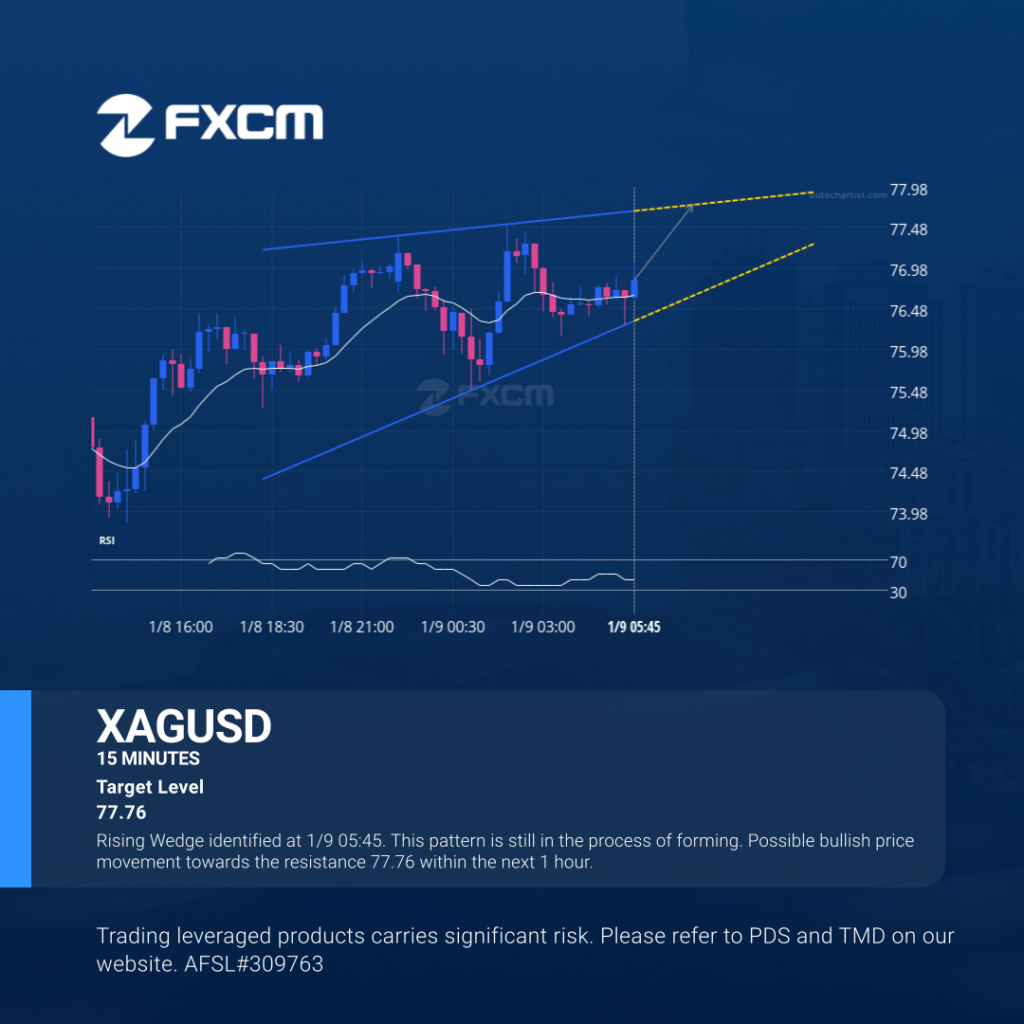
Rising Wedge identified at 1/9 05:45. This pattern is still in the process of forming. Possible bullish price movement towards the resistance 77.76 within the next 1 hour. Past performance is not an indicator of future results. Trading leveraged products carries significant risk. Please refer to PDS and TMD on our website. AFSL#309763
Índices de Análisis Técnico
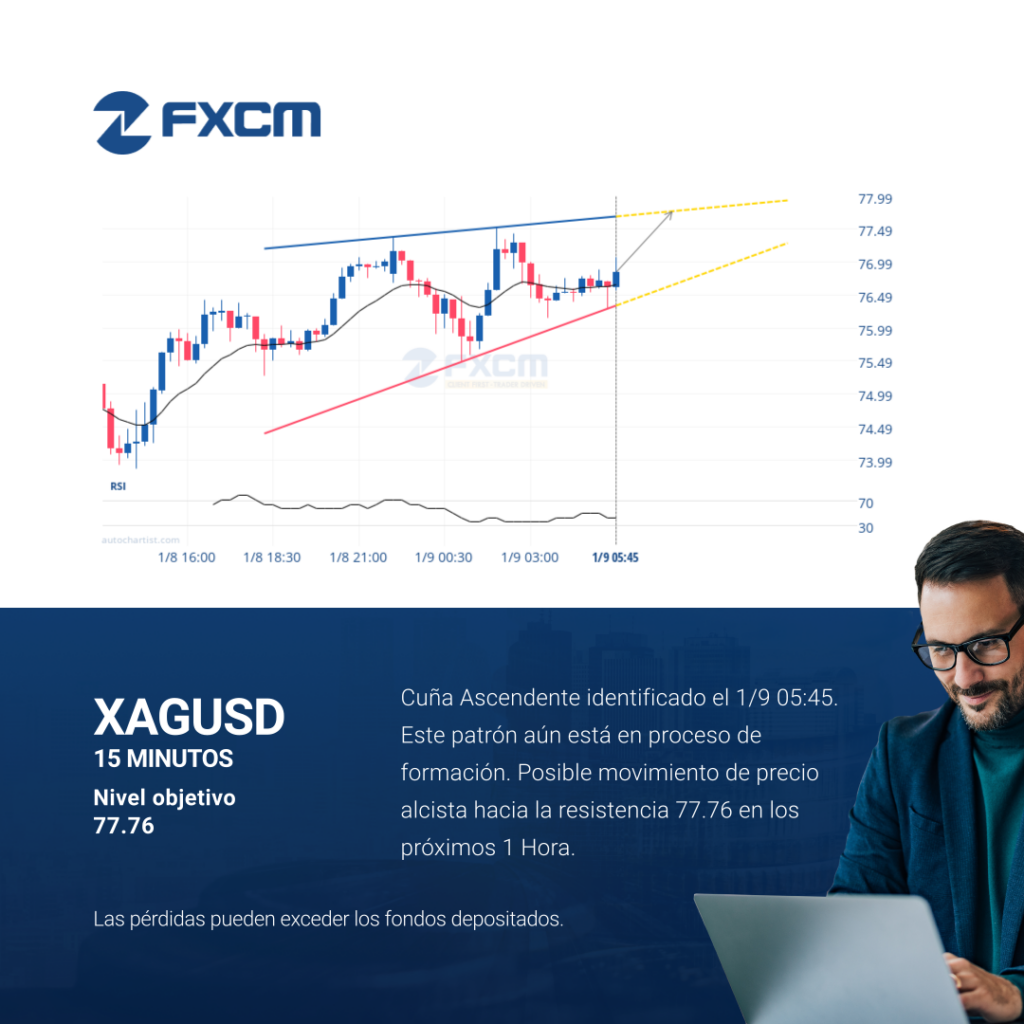
Cuña Ascendente identificado el 1/9 05:45. Este patrón aún está en proceso de formación. Posible movimiento de precio alcista hacia la resistencia 77.76 en los próximos 1 Hora. Las pérdidas pueden exceder los depósitos.
Análisis Técnico Cripto
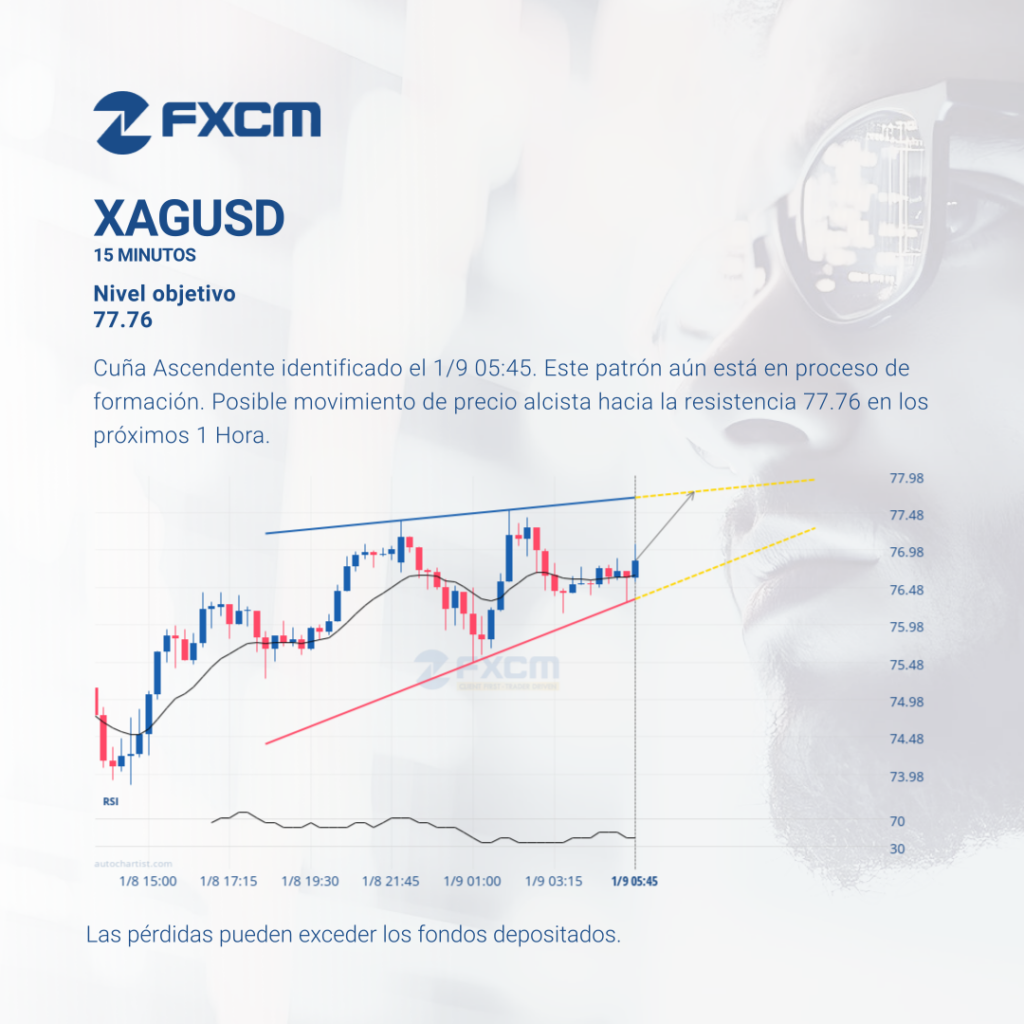
Cuña Ascendente identificado el 1/9 05:45. Este patrón aún está en proceso de formación. Posible movimiento de precio alcista hacia la resistencia 77.76 en los próximos 1 Hora. El rendimiento pasado no es indicativo de resultados futuros. Las pérdidas pueden exceder los depósitos.
Technical Analysis Indices
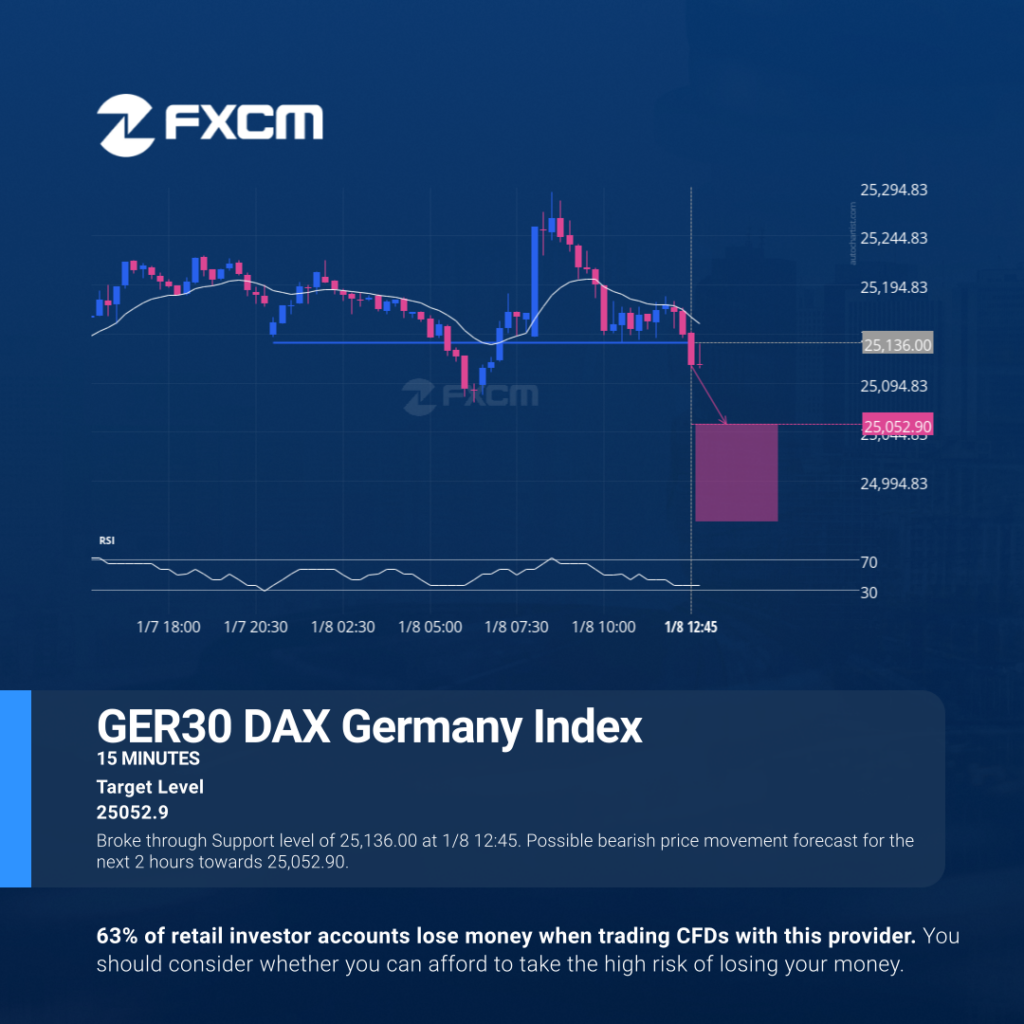
Broke through Support level of 25,136.00 at 1/8 12:45. Possible bearish price movement forecast for the next 2 hours towards 25,052.90. Past performance is not an indicator of future results. Losses can exceed deposits.
Technical Analysis Indices
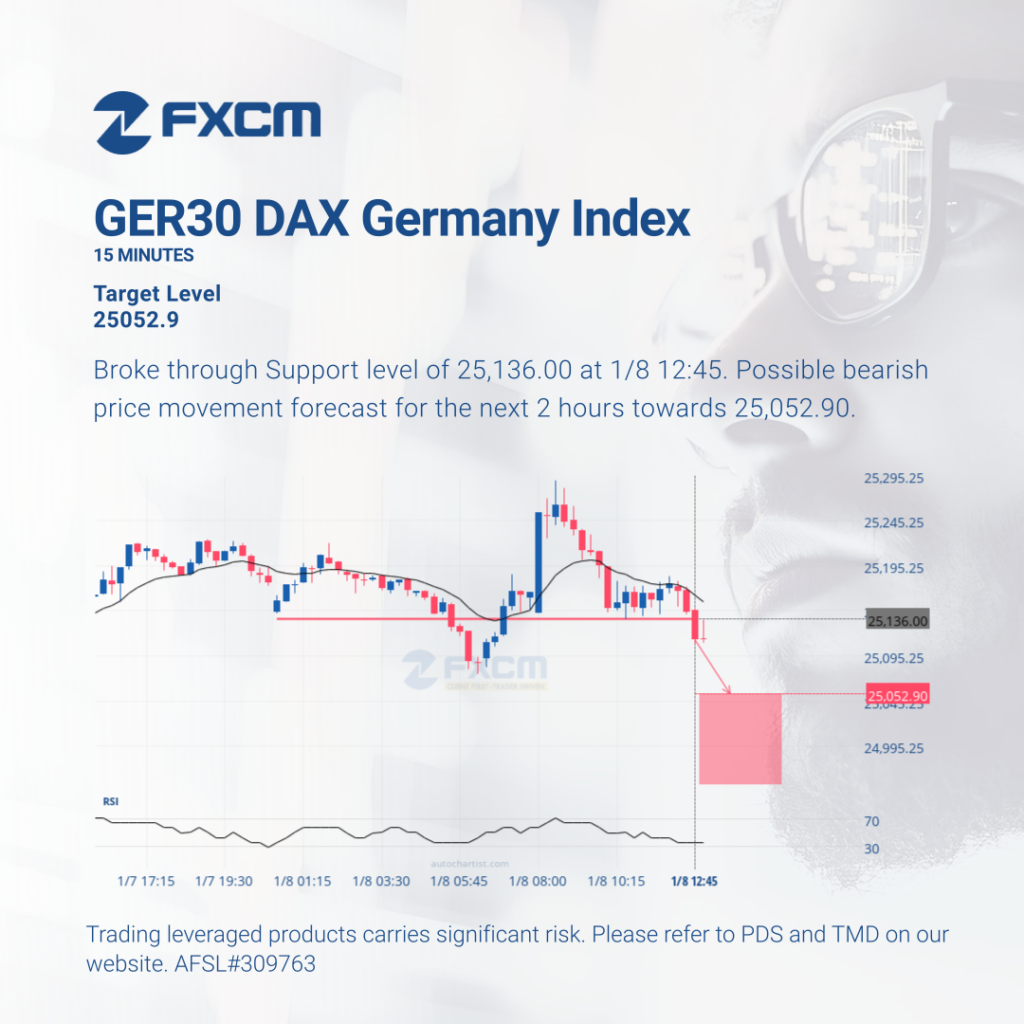
Broke through Support level of 25,136.00 at 1/8 12:45. Possible bearish price movement forecast for the next 2 hours towards 25,052.90. Past performance is not an indicator of future results. Trading leveraged products carries significant risk. Please refer to PDS and TMD on our website. AFSL#309763
Análisis Técnico Cripto
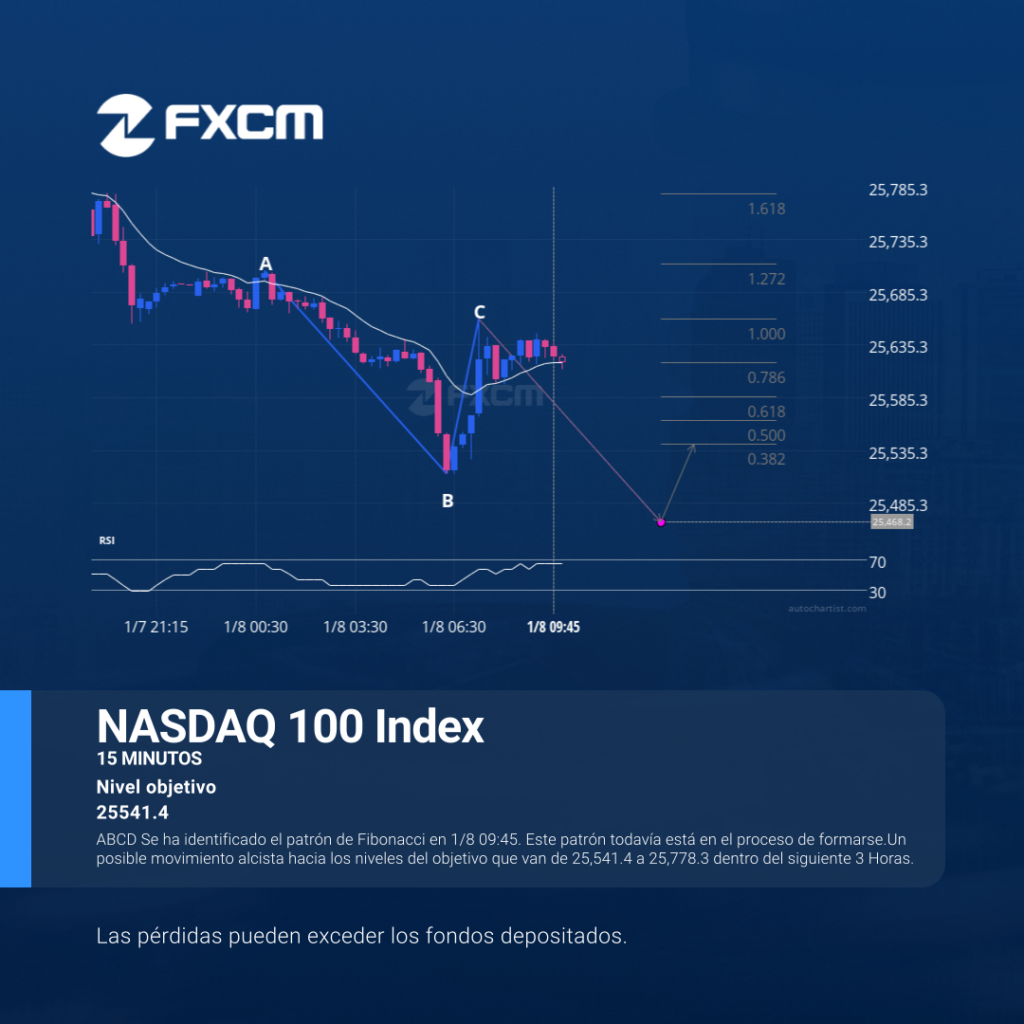
ABCD Se ha identificado el patrón de Fibonacci en 1/8 09:45. Este patrón todavía está en el proceso de formarse.Un posible movimiento alcista hacia los niveles del objetivo que van de 25,541.4 a 25,778.3 dentro del siguiente 3 Horas. El rendimiento pasado no es indicativo de resultados futuros. Las pérdidas pueden exceder los depósitos.
Technical Analysis Indices
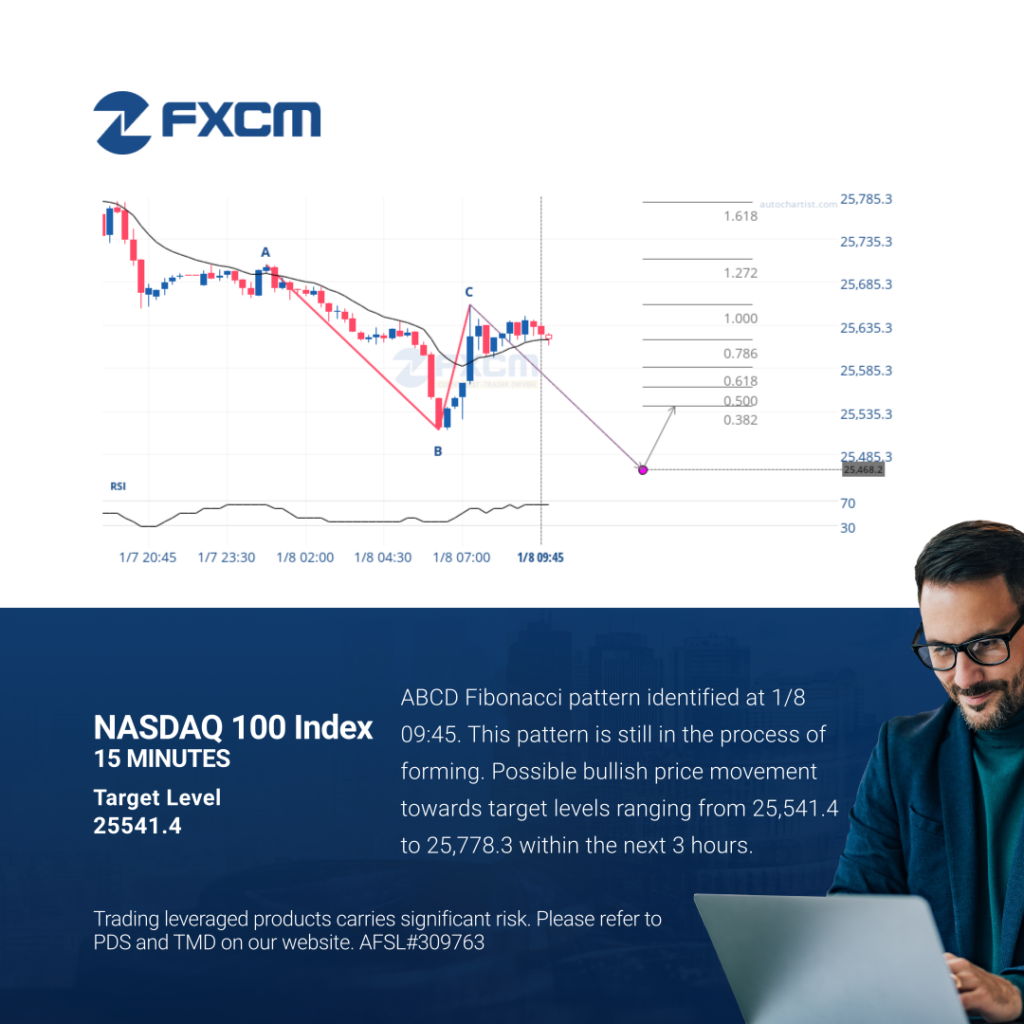
ABCD Fibonacci pattern identified at 1/8 09:45. This pattern is still in the process of forming. Possible bullish price movement towards target levels ranging from 25,541.4 to 25,778.3 within the next 3 hours. Past performance is not an indicator of future results. Trading leveraged products carries significant risk. Please refer to PDS and TMD on […]