Índices de Análisis Técnico
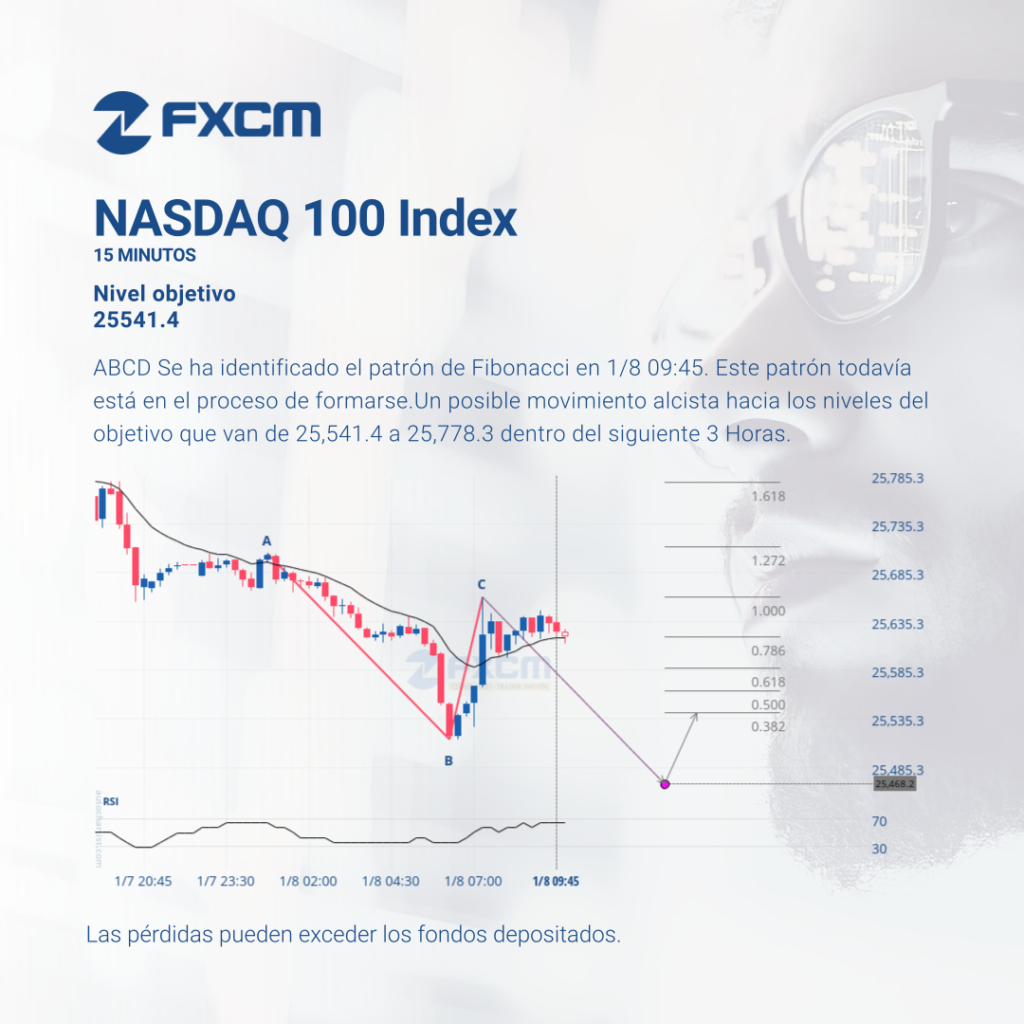
ABCD Se ha identificado el patrón de Fibonacci en 1/8 09:45. Este patrón todavía está en el proceso de formarse.Un posible movimiento alcista hacia los niveles del objetivo que van de 25,541.4 a 25,778.3 dentro del siguiente 3 Horas. Las pérdidas pueden exceder los depósitos.
Technical Analysis Indices
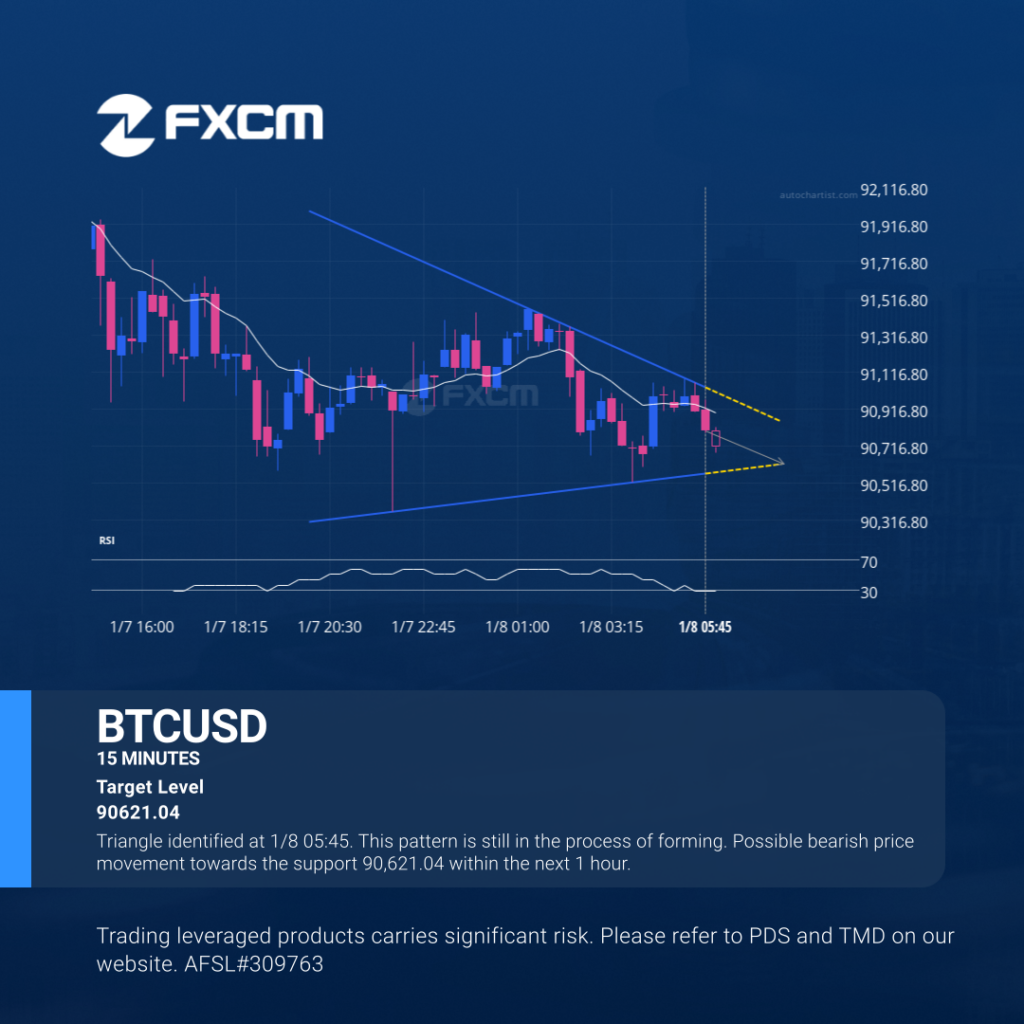
Triangle identified at 1/8 05:45. This pattern is still in the process of forming. Possible bearish price movement towards the support 90,621.04 within the next 1 hour. Past performance is not an indicator of future results. Trading leveraged products carries significant risk. Please refer to PDS and TMD on our website. AFSL#309763
Technical Analysis Indices
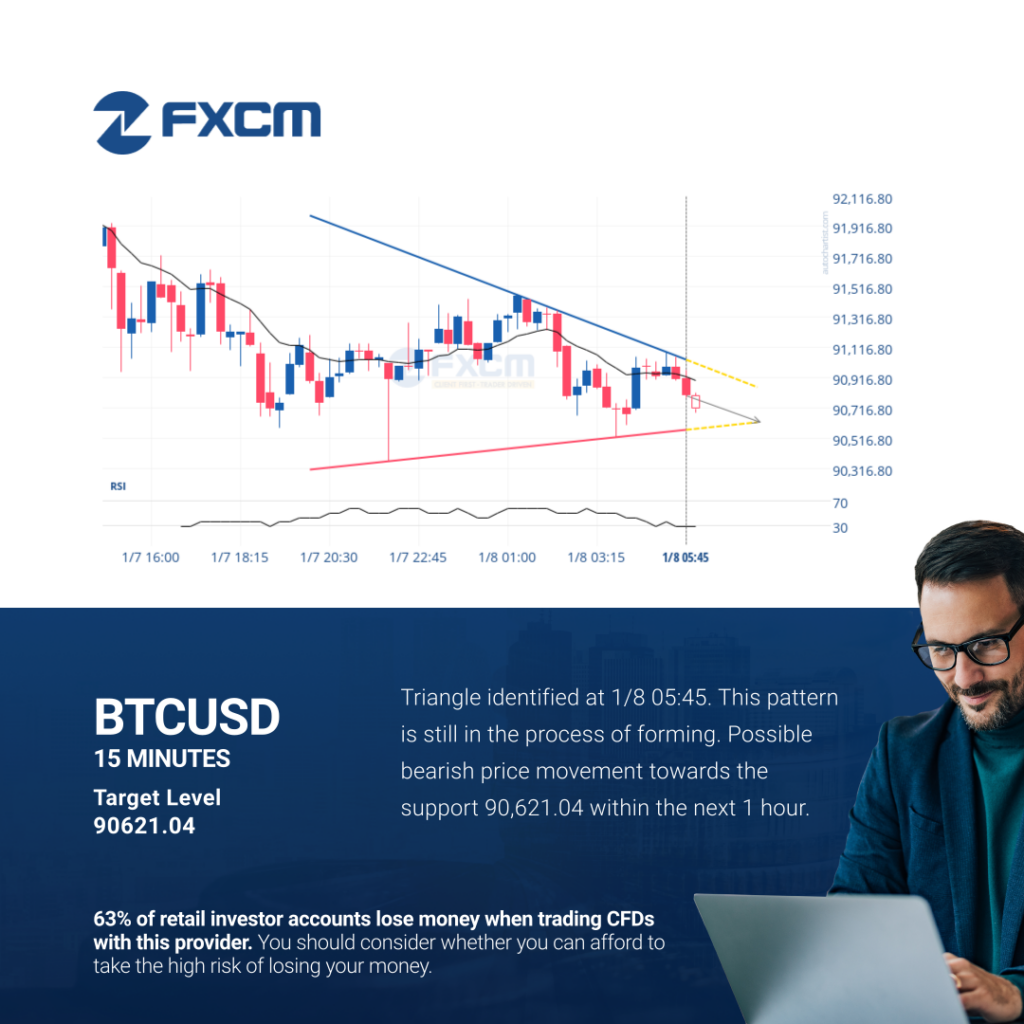
Triangle identified at 1/8 05:45. This pattern is still in the process of forming. Possible bearish price movement towards the support 90,621.04 within the next 1 hour. Past performance is not an indicator of future results. Losses can exceed deposits.
Índices de Análisis Técnico
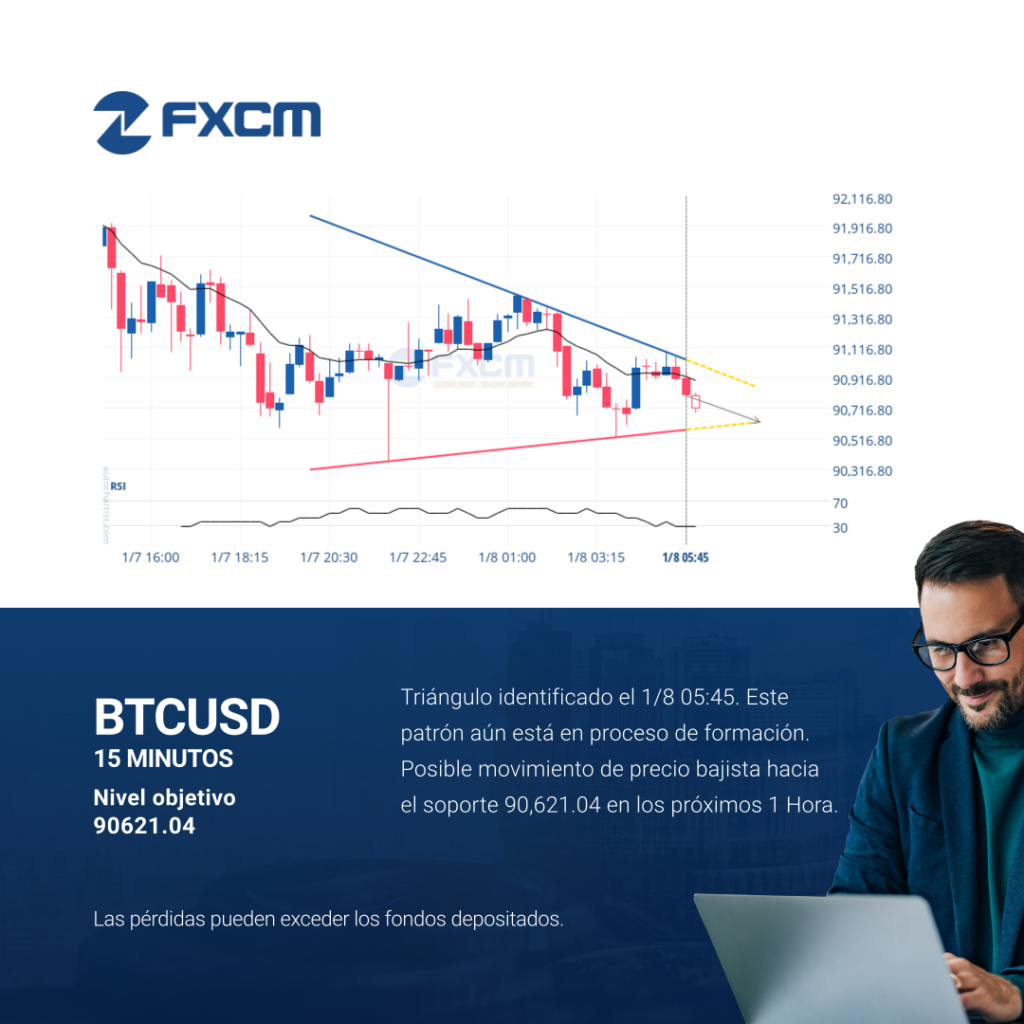
Triángulo identificado el 1/8 05:45. Este patrón aún está en proceso de formación. Posible movimiento de precio bajista hacia el soporte 90,621.04 en los próximos 1 Hora. Las pérdidas pueden exceder los depósitos.
Índices de Análisis Técnico
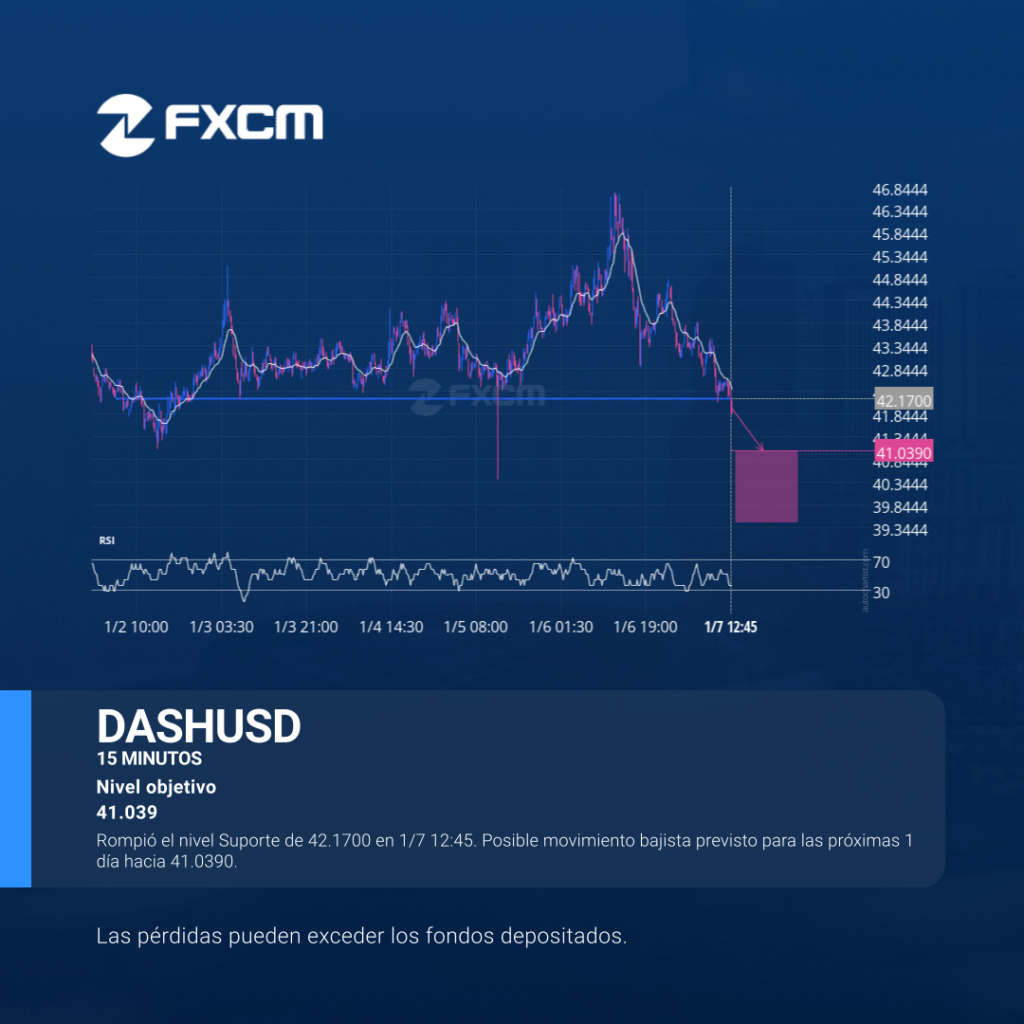
Rompió el nivel Suporte de 42.1700 en 1/7 12:45. Posible movimiento bajista previsto para las próximas 1 día hacia 41.0390. Las pérdidas pueden exceder los depósitos.
Technical Analysis Indices
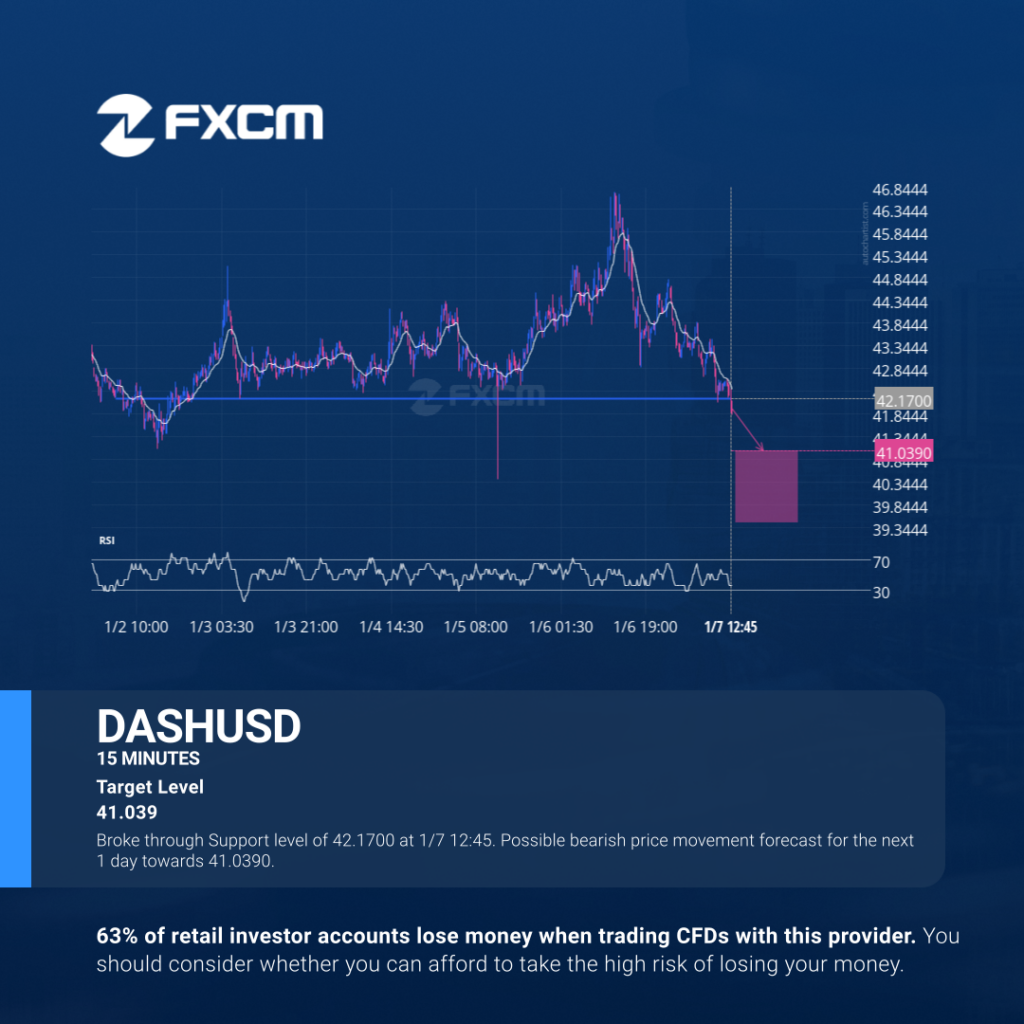
Broke through Support level of 42.1700 at 1/7 12:45. Possible bearish price movement forecast for the next 1 day towards 41.0390. Past performance is not an indicator of future results. Losses can exceed deposits.
Technical Analysis Indices
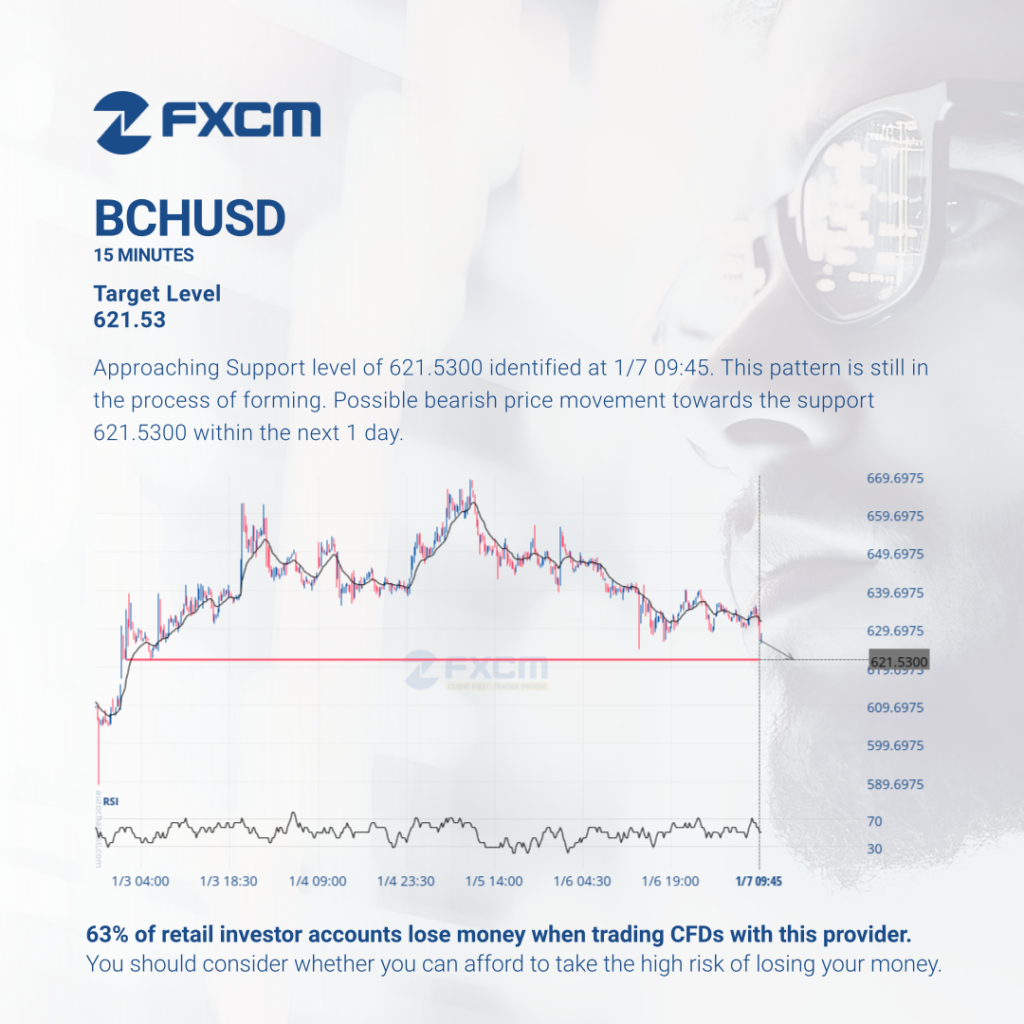
Approaching Support level of 621.5300 identified at 1/7 09:45. This pattern is still in the process of forming. Possible bearish price movement towards the support 621.5300 within the next 1 day. Past performance is not an indicator of future results. Losses can exceed deposits.
Análisis Técnico Cripto
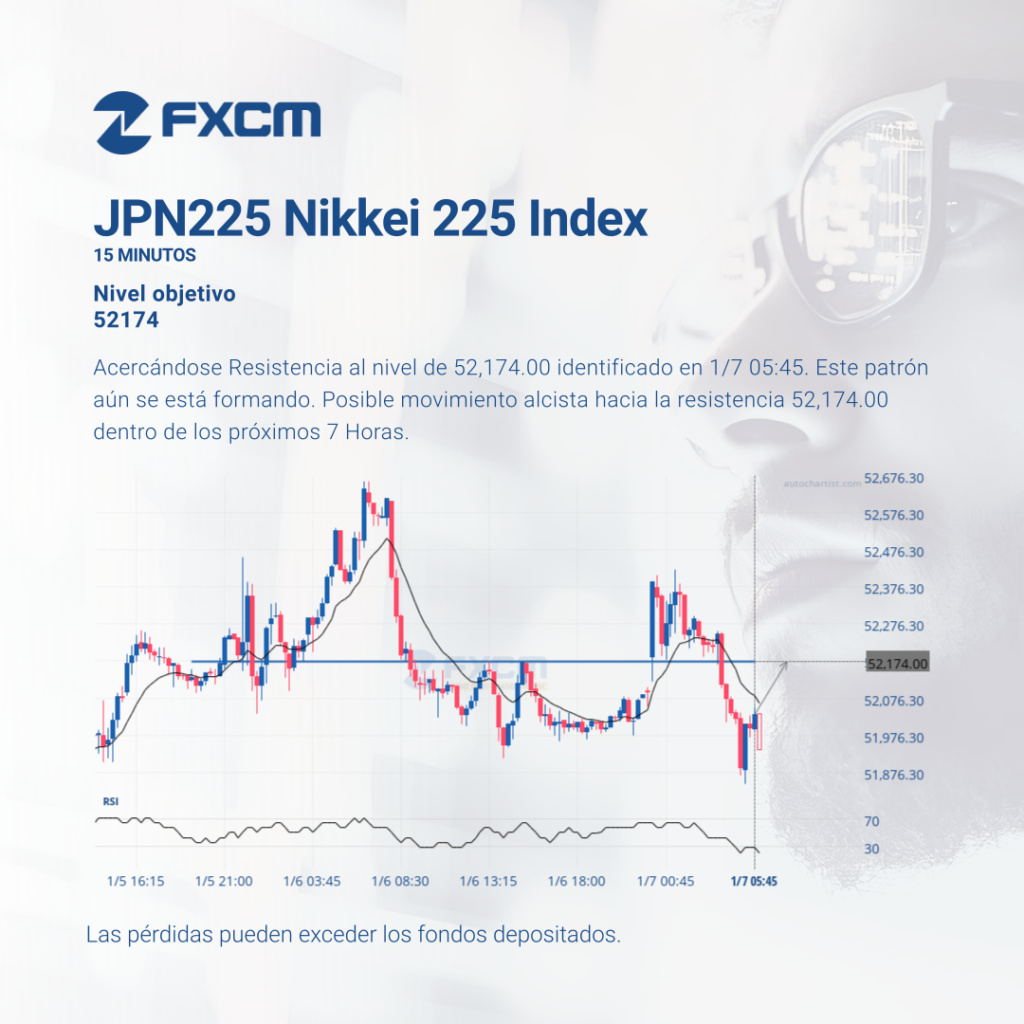
Acercándose Resistencia al nivel de 52,174.00 identificado en 1/7 05:45. Este patrón aún se está formando. Posible movimiento alcista hacia la resistencia 52,174.00 dentro de los próximos 7 Horas. El rendimiento pasado no es indicativo de resultados futuros. Las pérdidas pueden exceder los depósitos.
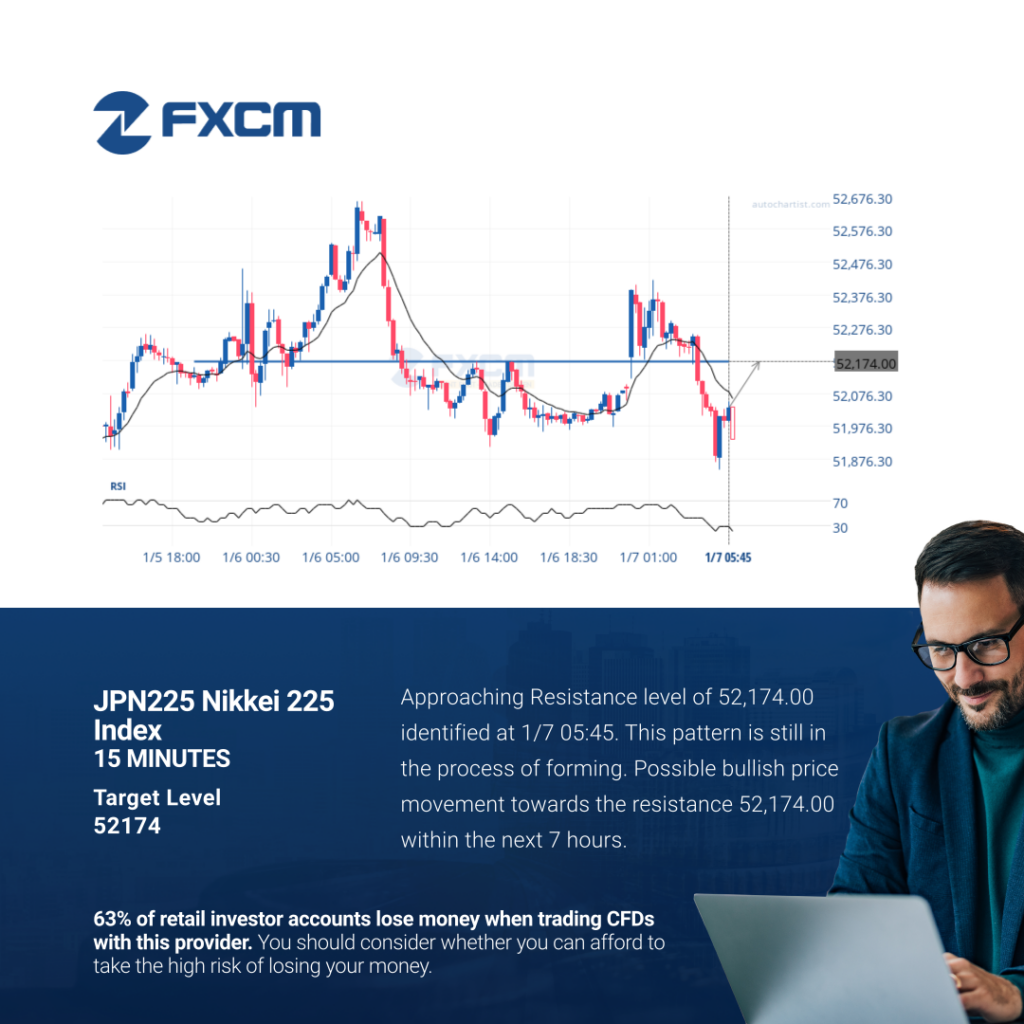
Technical Analysis Indices
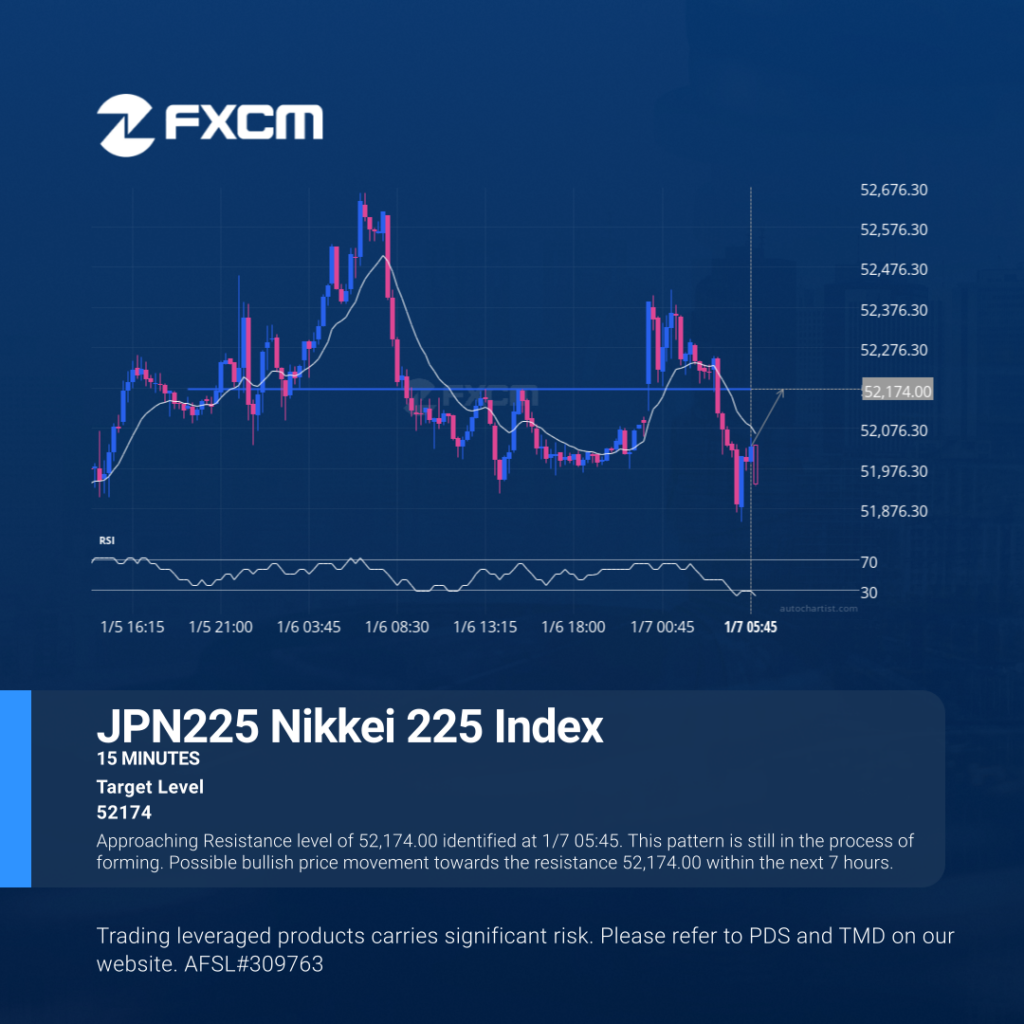
Approaching Resistance level of 52,174.00 identified at 1/7 05:45. This pattern is still in the process of forming. Possible bullish price movement towards the resistance 52,174.00 within the next 7 hours. Past performance is not an indicator of future results. Trading leveraged products carries significant risk. Please refer to PDS and TMD on our website. […]
Technical Analysis Indices
Approaching Resistance level of 52,174.00 identified at 1/7 05:45. This pattern is still in the process of forming. Possible bullish price movement towards the resistance 52,174.00 within the next 7 hours. Past performance is not an indicator of future results. Losses can exceed deposits.