Should we expect a breakout or a rebound on ESP35?
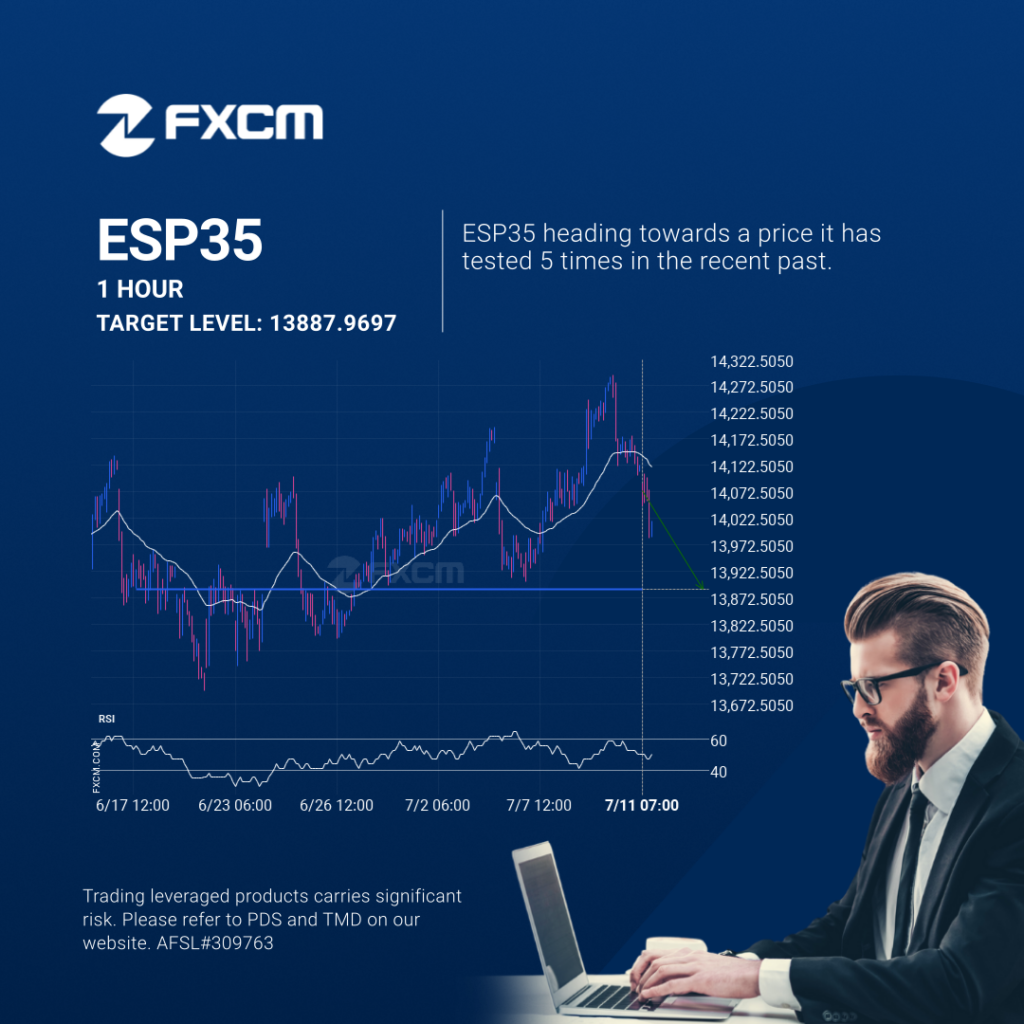
ESP35 is moving towards a key support level at 13887.9697. This is a previously tested level for ESP35. This could be a good trading opportunity, either at the spot price, or after breaching this level. Past performance is not an indicator of future results. Trading leveraged products carries significant risk. Please refer to PDS and […]
¿Deberíamos esperar una irrupción o una recuperación del ESP35?
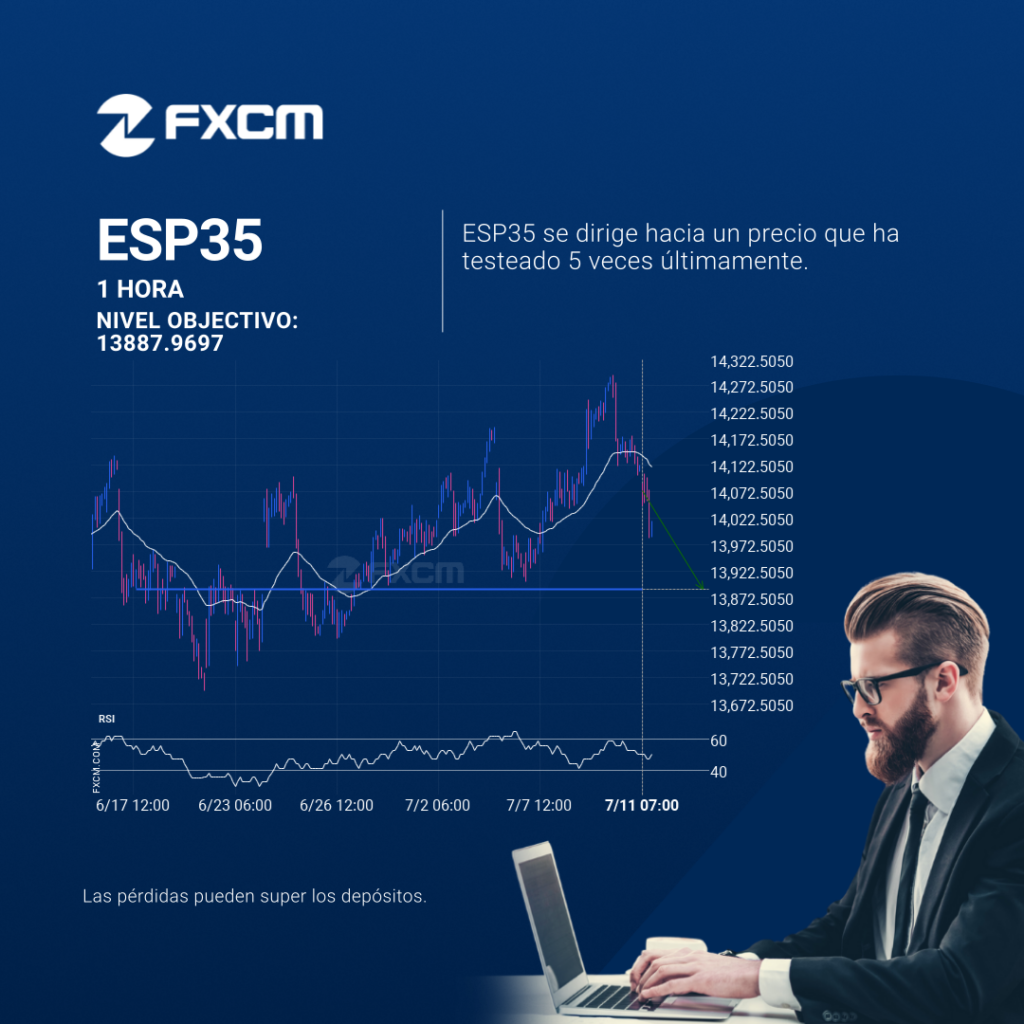
ESP35 se está moviendo hacia un nivel clave de soporte en 13887.9697. Este es un nivel que ESP35 ya testeó previamente. Esta podría ser una buena oportunidad para operar, ya sea al precio actual o después de superar este nivel. El rendimiento pasado no es indicativo de resultados futuros. Las pérdidas pueden exceder los fondos […]
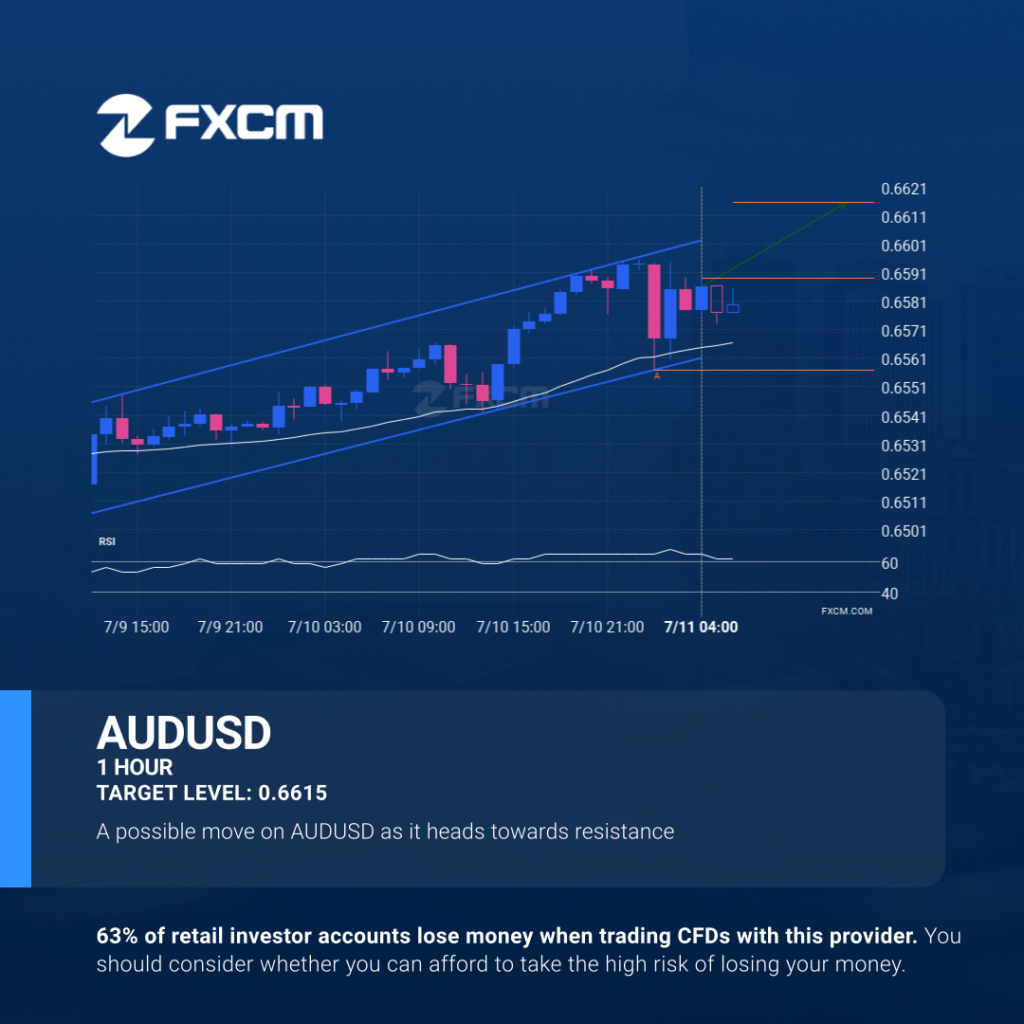
Possible breach of resistance level by AUDUSD
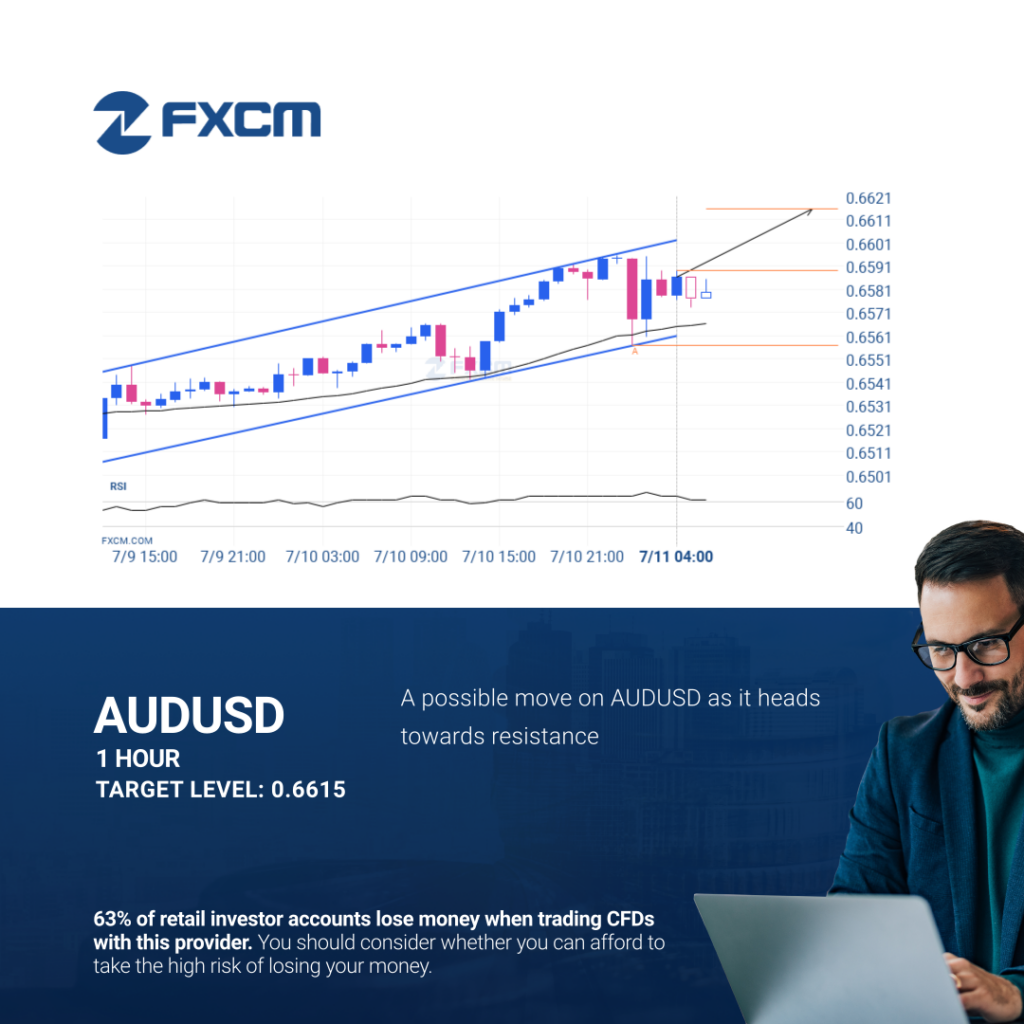
The movement of AUDUSD towards the resistance line of a Channel Up is yet another test of the line it reached numerous times in the past. This line test could happen in the next 9 hours, but it is uncertain whether it will result in a breakout through this line, or simply rebound back to […]
Possible breach of resistance level by AUDUSD
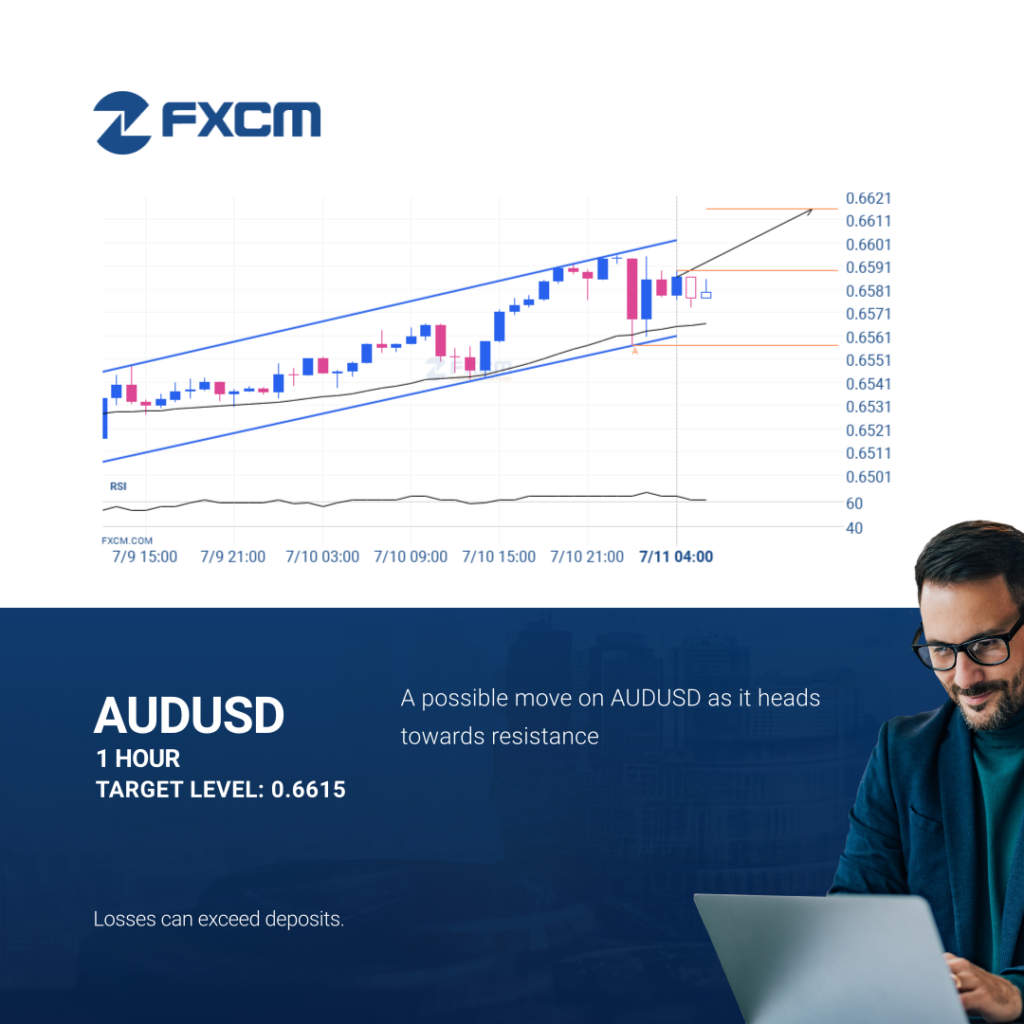
The movement of AUDUSD towards the resistance line of a Channel Up is yet another test of the line it reached numerous times in the past. This line test could happen in the next 9 hours, but it is uncertain whether it will result in a breakout through this line, or simply rebound back to […]
Posible ruptura del nivel de resistencia en el AUDUSD
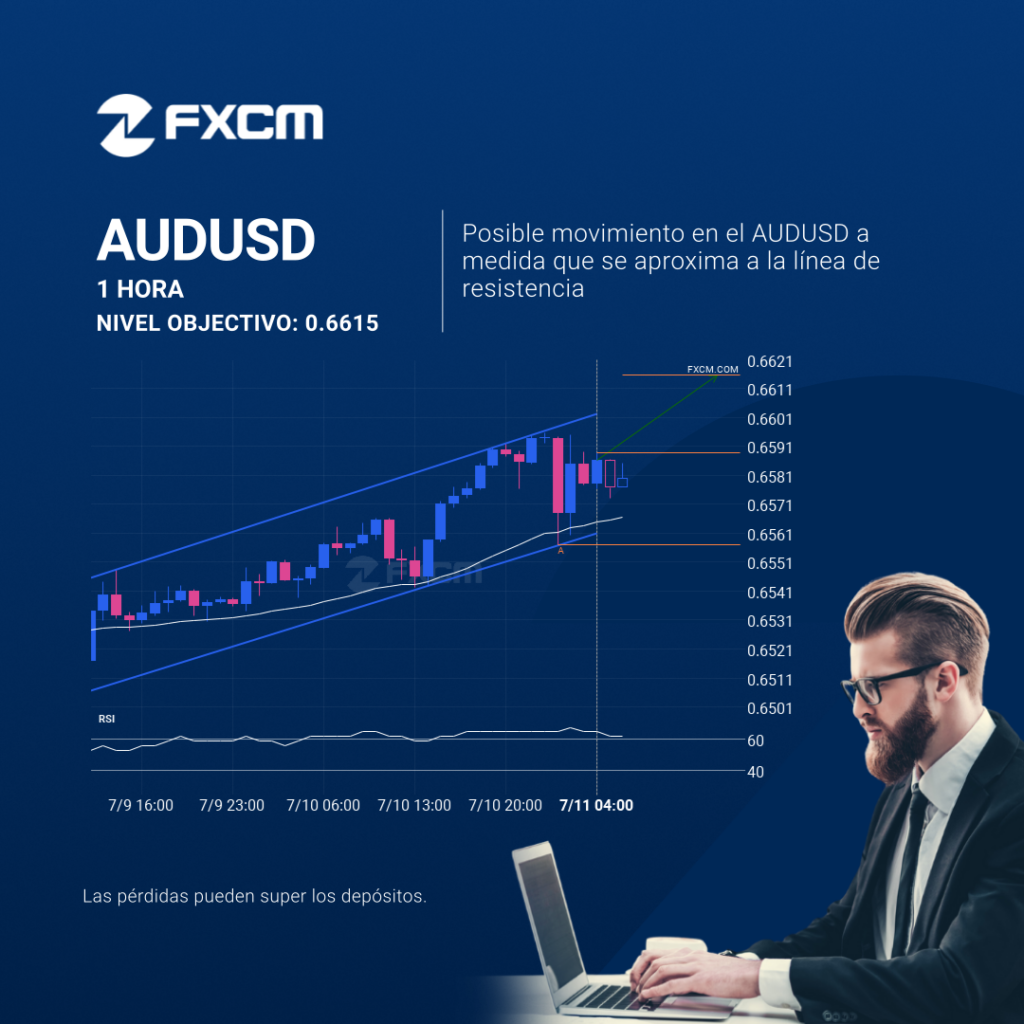
El movimiento del AUDUSD hacia la línea de resistencia de un Canal alcista es otra prueba más de la línea que ha alcanzado en numerosas ocasiones durante el pasado. Esta prueba de la línea podría ocurrir en las próximas 9 horas, pero no sabemos si dará como resultado una ruptura a través de esta línea […]
Resistance breakout on HKG33
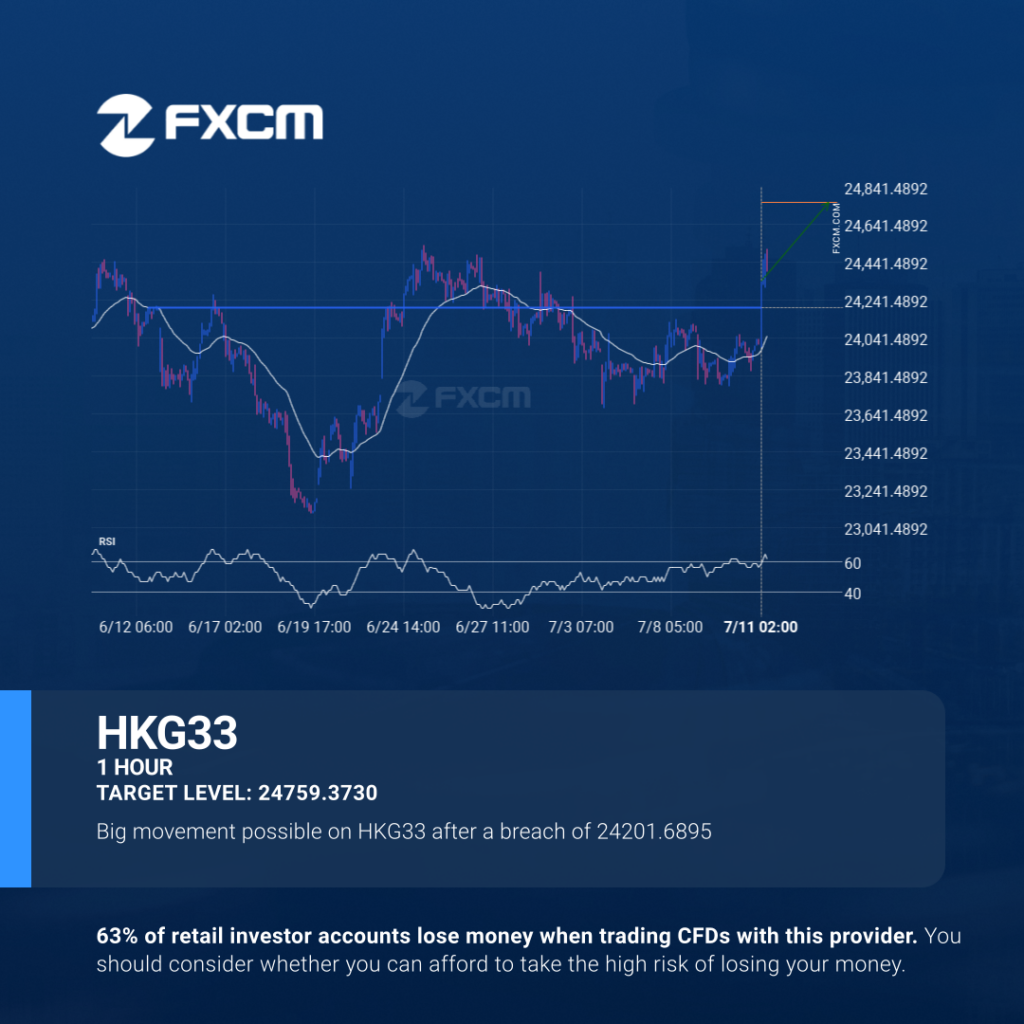
HKG33 has broken through a line of 24201.6895. If this breakout holds true, we could see the price of HKG33 heading towards 24759.3730 within the next 4 days. But don’t be so quick to trade, it has tested this line numerous times in the past, so you should probably confirm the breakout before placing any […]
Possible breach of resistance level by AUDUSD
The movement of AUDUSD towards the resistance line of a Channel Up is yet another test of the line it reached numerous times in the past. This line test could happen in the next 9 hours, but it is uncertain whether it will result in a breakout through this line, or simply rebound back to […]
¿Hacia dónde se dirige el BTCUSD?
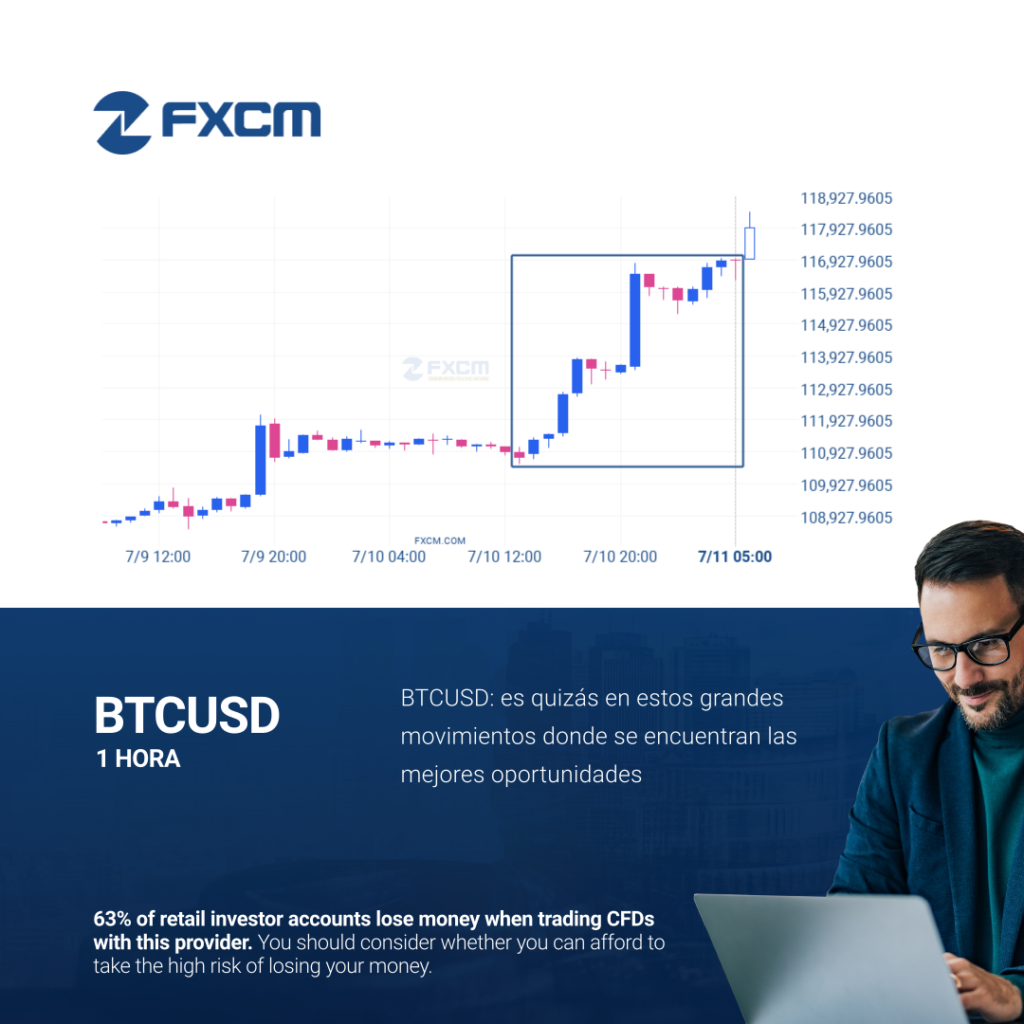
El BTCUSD ha ascendido un 5,59% de 110722.7 a 116906.92 en 16 horas. El rendimiento pasado no es indicativo de resultados futuros. Las pérdidas pueden exceder los fondos depositados.
Rotura de Resistencia en HKG33
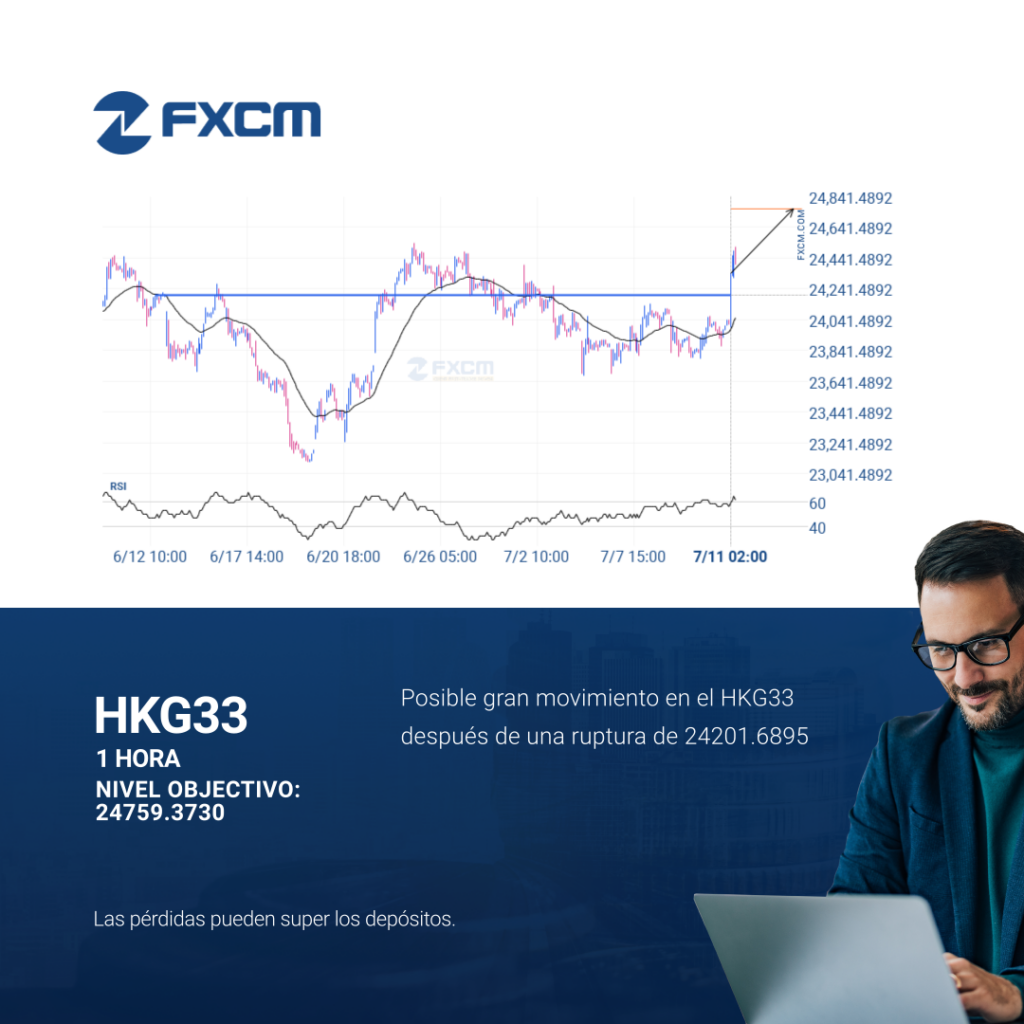
El HKG33 ha atravesado una línea de 24201.6895. Si esta rotura se mantiene, podríamos ver el precio del HKG33 dirigiéndose al nivel de 24759.3730 en las próximas 4 días. Pero no debe apresurarse a la hora de operar, porque ya ha probado esta línea en numerosas ocasiones durante el pasado, por lo que probablemente debería […]
Resistance breakout on HKG33

HKG33 has broken through a line of 24201.6895. If this breakout holds true, we could see the price of HKG33 heading towards 24759.3730 within the next 4 days. But don’t be so quick to trade, it has tested this line numerous times in the past, so you should probably confirm the breakout before placing any […]