Índices de Análisis Técnico
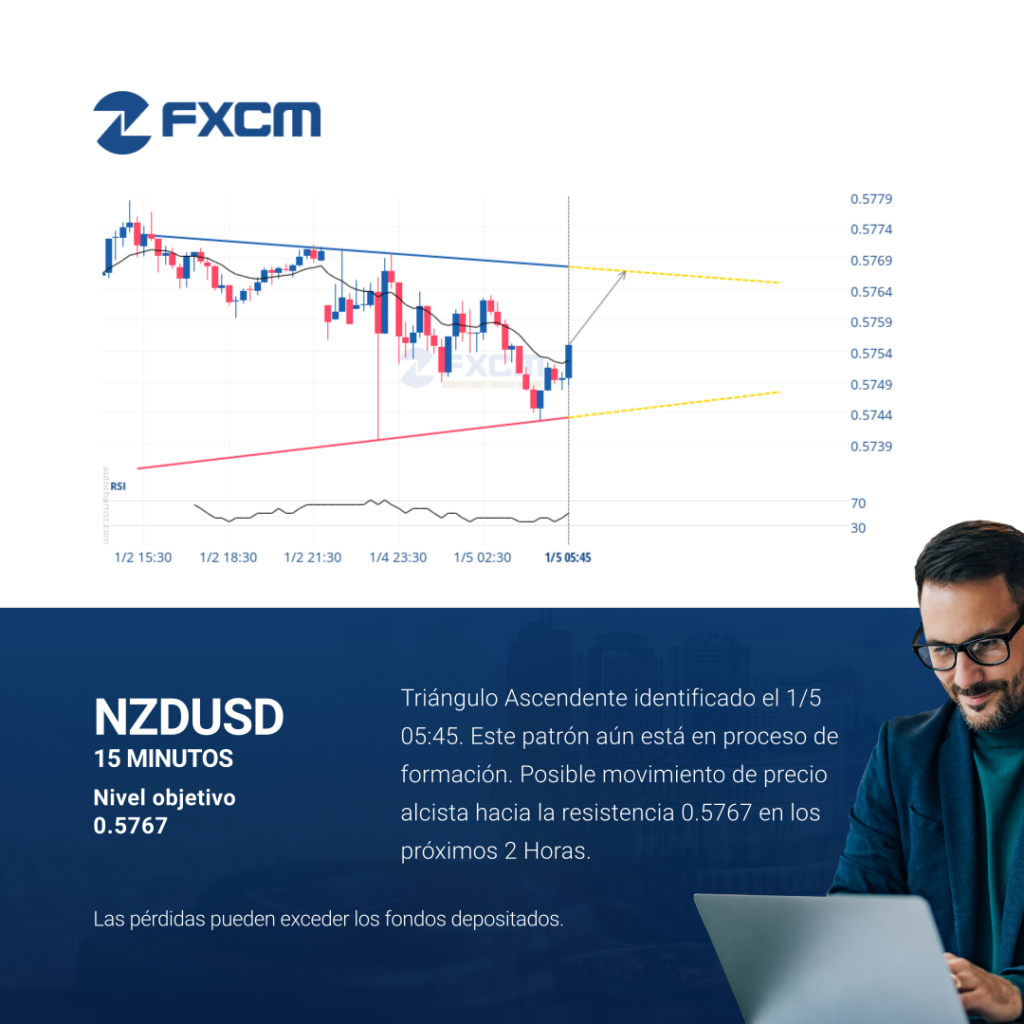
Triángulo Ascendente identificado el 1/5 05:45. Este patrón aún está en proceso de formación. Posible movimiento de precio alcista hacia la resistencia 0.5767 en los próximos 2 Horas. Las pérdidas pueden exceder los depósitos.
Technical Analysis Indices
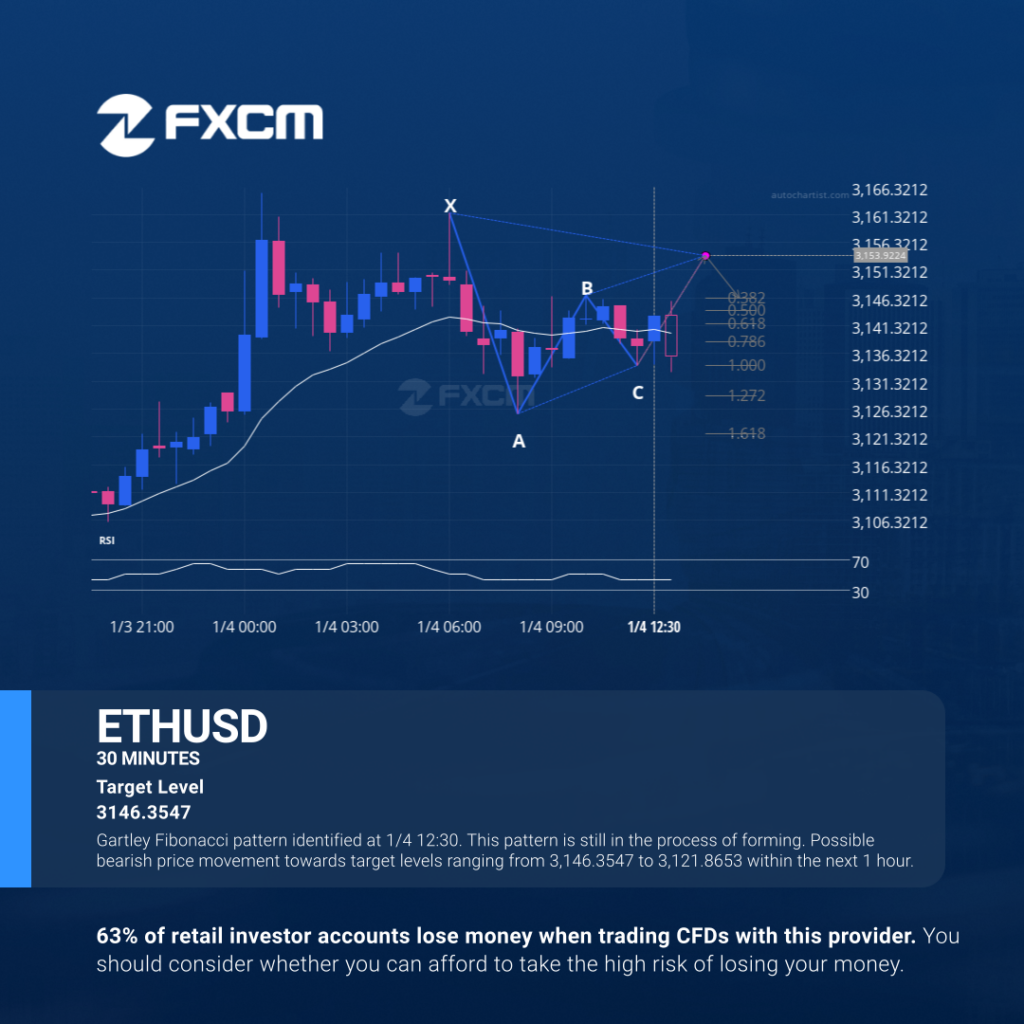
Gartley Fibonacci pattern identified at 1/4 12:30. This pattern is still in the process of forming. Possible bearish price movement towards target levels ranging from 3,146.3547 to 3,121.8653 within the next 1 hour. Past performance is not an indicator of future results. Losses can exceed deposits.
Technical Analysis Indices
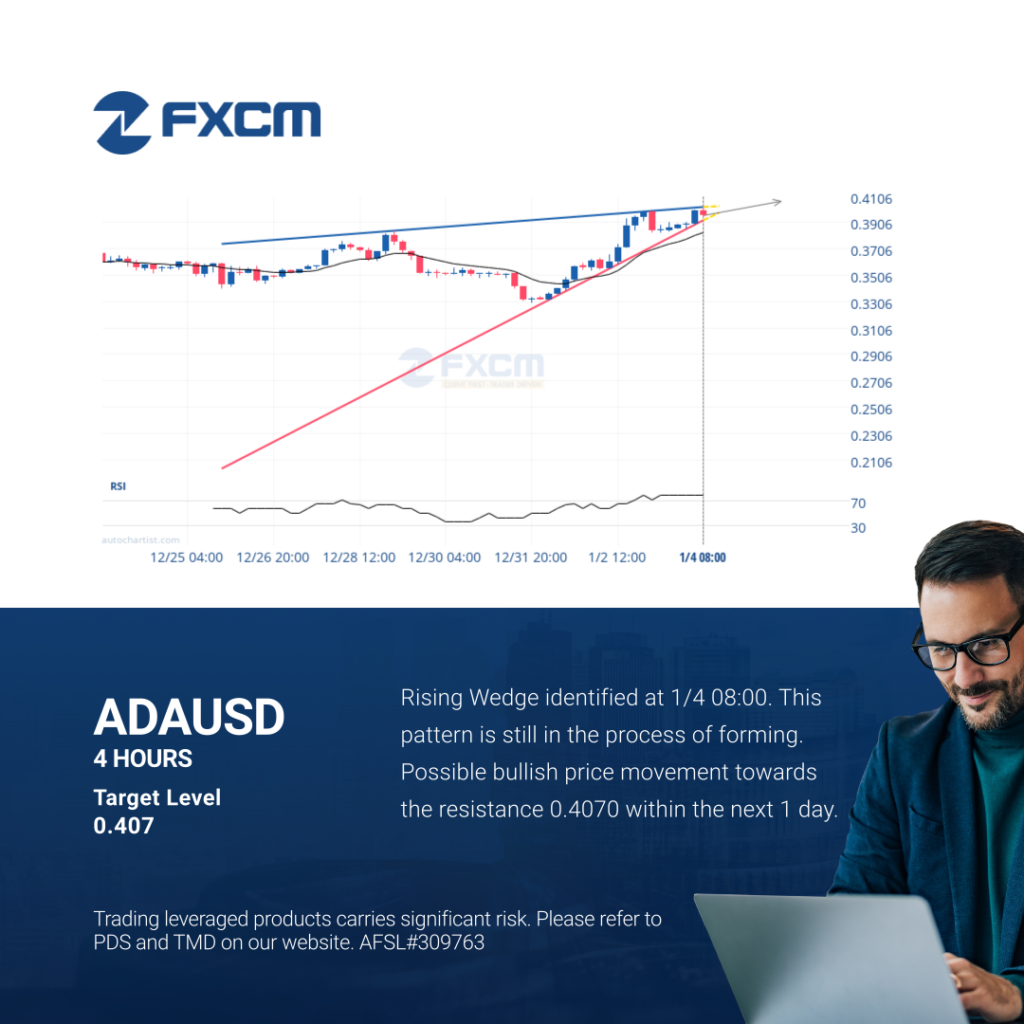
Rising Wedge identified at 1/4 08:00. This pattern is still in the process of forming. Possible bullish price movement towards the resistance 0.4070 within the next 1 day. Past performance is not an indicator of future results. Trading leveraged products carries significant risk. Please refer to PDS and TMD on our website. AFSL#309763
Análisis Técnico Cripto
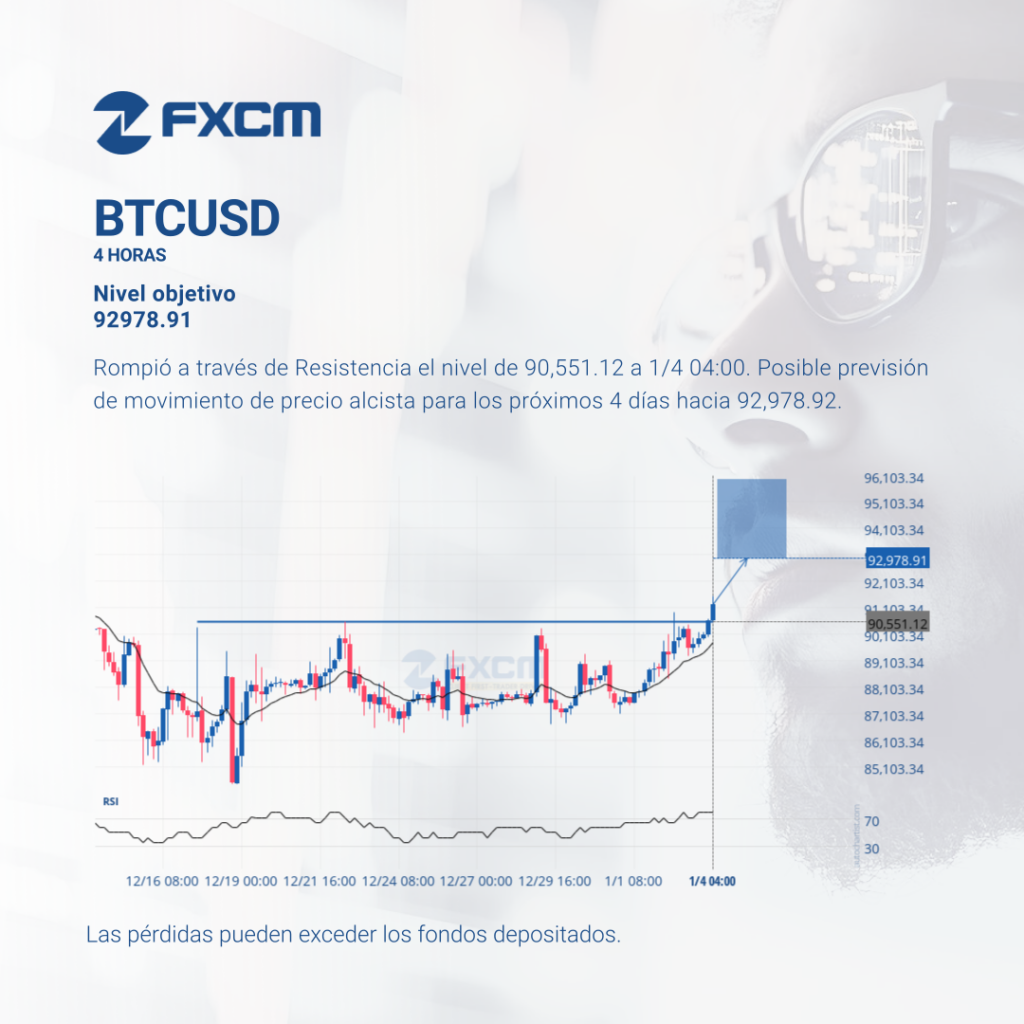
Rompió a través de Resistencia el nivel de 90,551.12 a 1/4 04:00. Posible previsión de movimiento de precio alcista para los próximos 4 días hacia 92,978.92. El rendimiento pasado no es indicativo de resultados futuros. Las pérdidas pueden exceder los depósitos.
Technical Analysis Indices

Gartley Fibonacci pattern identified at 1/4 05:15. This pattern is still in the process of forming. Possible bullish price movement towards target levels ranging from 3,138.5170 to 3,170.4830 within the next 2 hours. Past performance is not an indicator of future results. Losses can exceed deposits.
Índices de Análisis Técnico
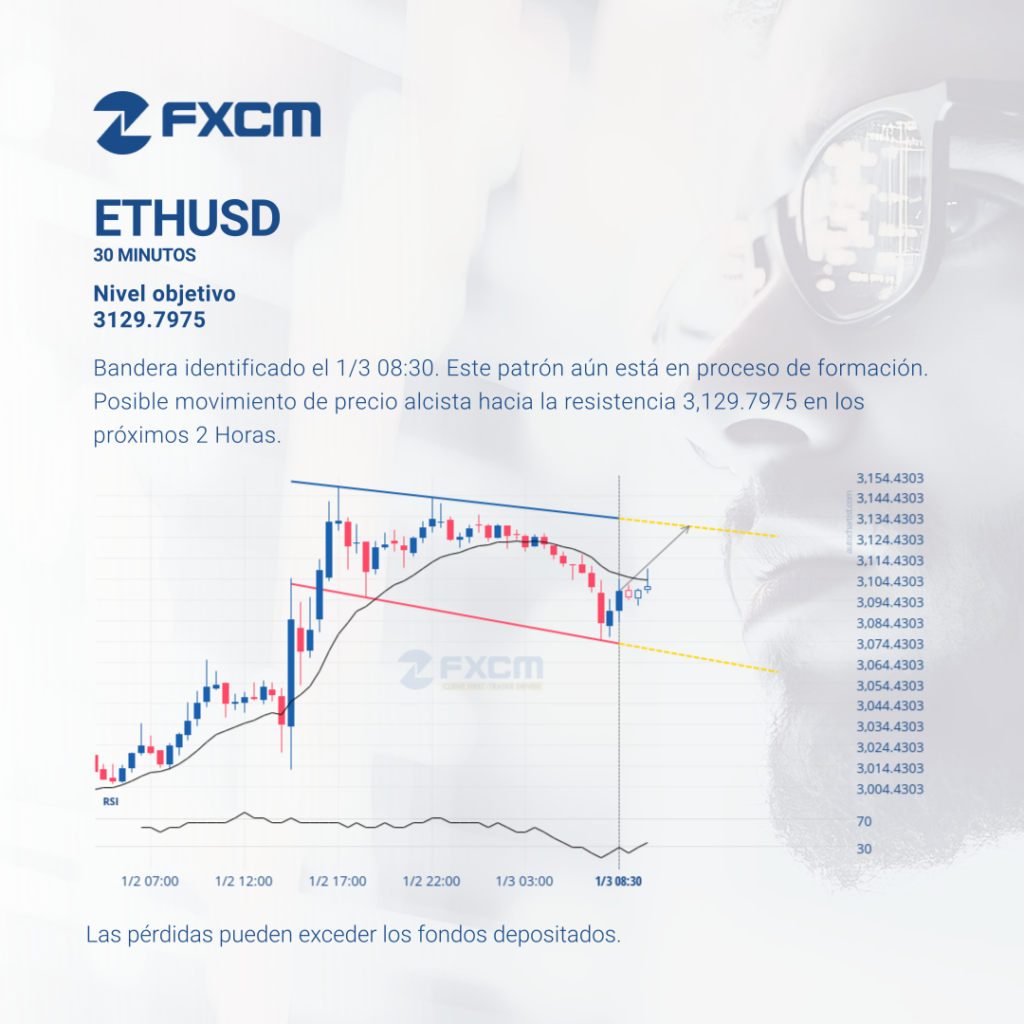
Bandera identificado el 1/3 08:30. Este patrón aún está en proceso de formación. Posible movimiento de precio alcista hacia la resistencia 3,129.7975 en los próximos 2 Horas. Las pérdidas pueden exceder los depósitos.
Technical Analysis Indices
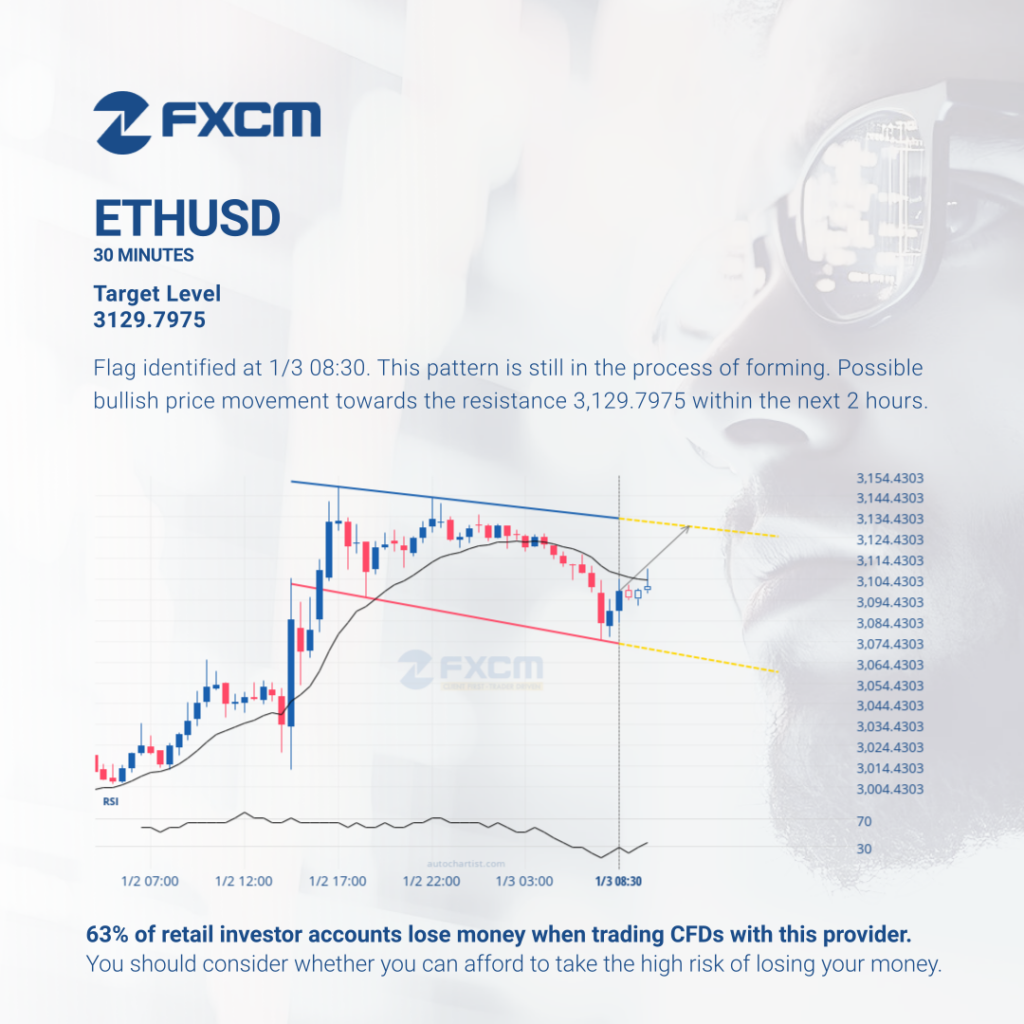
Flag identified at 1/3 08:30. This pattern is still in the process of forming. Possible bullish price movement towards the resistance 3,129.7975 within the next 2 hours. Past performance is not an indicator of future results. Losses can exceed deposits.
Technical Analysis Indices
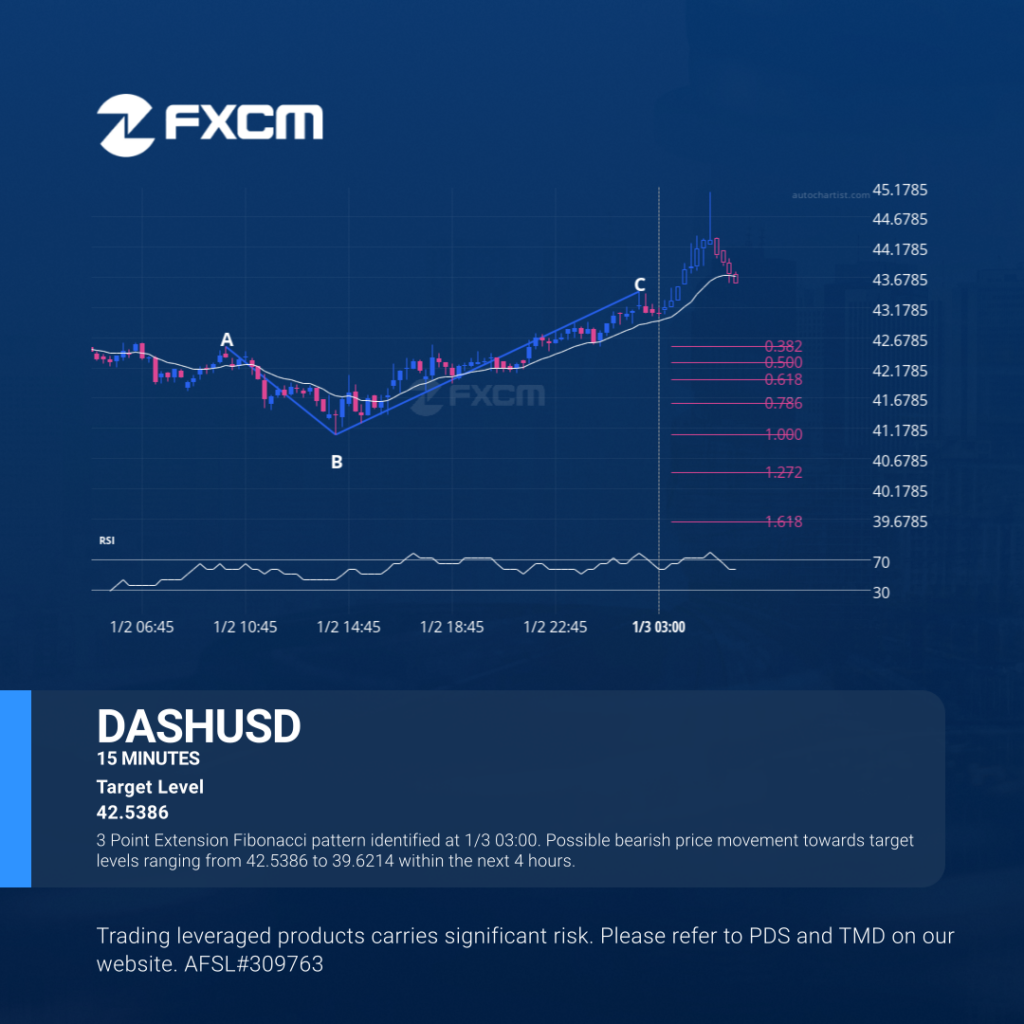
3 Point Extension Fibonacci pattern identified at 1/3 03:00. Possible bearish price movement towards target levels ranging from 42.5386 to 39.6214 within the next 4 hours. Past performance is not an indicator of future results. Trading leveraged products carries significant risk. Please refer to PDS and TMD on our website. AFSL#309763
Índices de Análisis Técnico
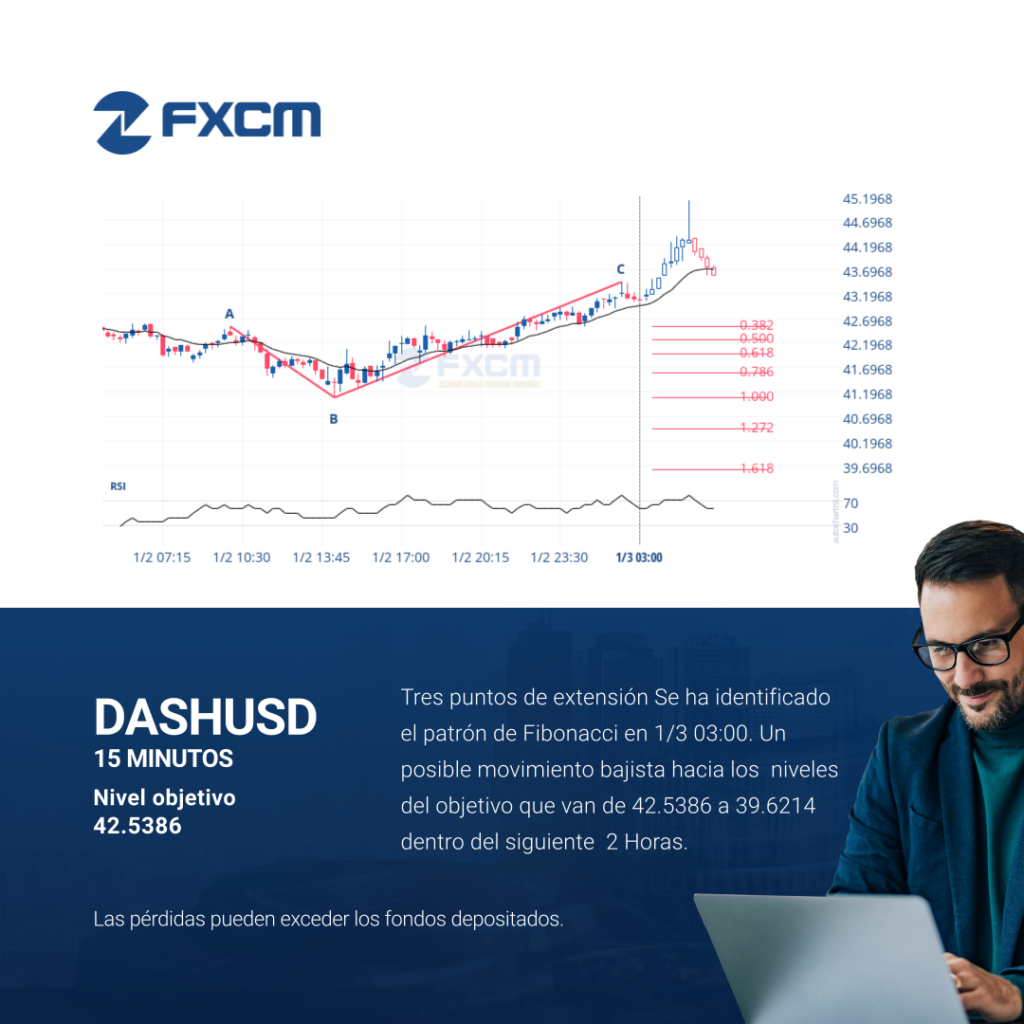
Tres puntos de extensión Se ha identificado el patrón de Fibonacci en 1/3 03:00. Un posible movimiento bajista hacia los niveles del objetivo que van de 42.5386 a 39.6214 dentro del siguiente 2 Horas. Las pérdidas pueden exceder los depósitos.
Technical Analysis Indices
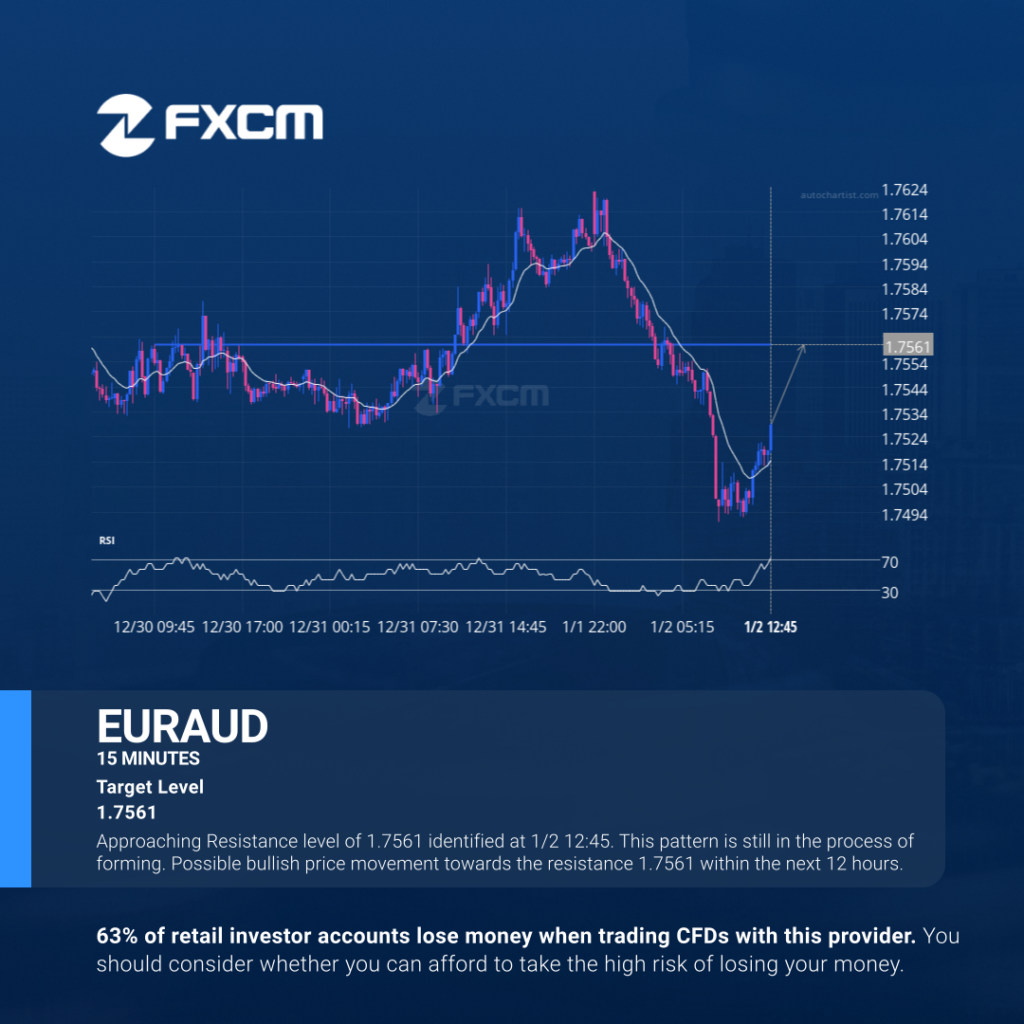
Approaching Resistance level of 1.7561 identified at 1/2 12:45. This pattern is still in the process of forming. Possible bullish price movement towards the resistance 1.7561 within the next 12 hours. Past performance is not an indicator of future results. Losses can exceed deposits.