¿Deberíamos esperar una ruptura o una recuperación del BTCUSD?

El BTCUSD avanza hacia la línea de soporte de un Canal alcista, que ya ha probado varias veces en el pasado. Hemos visto un retroceso antes desde esta línea, así que en esta etapa no está claro si atravesará esta línea o se recuperará como lo ha hecho anteriormente. Si el BTCUSD continúa con esta […]
AUDUSD: línea de resistencia rota a las 2025-05-13T18:00:00.000Z
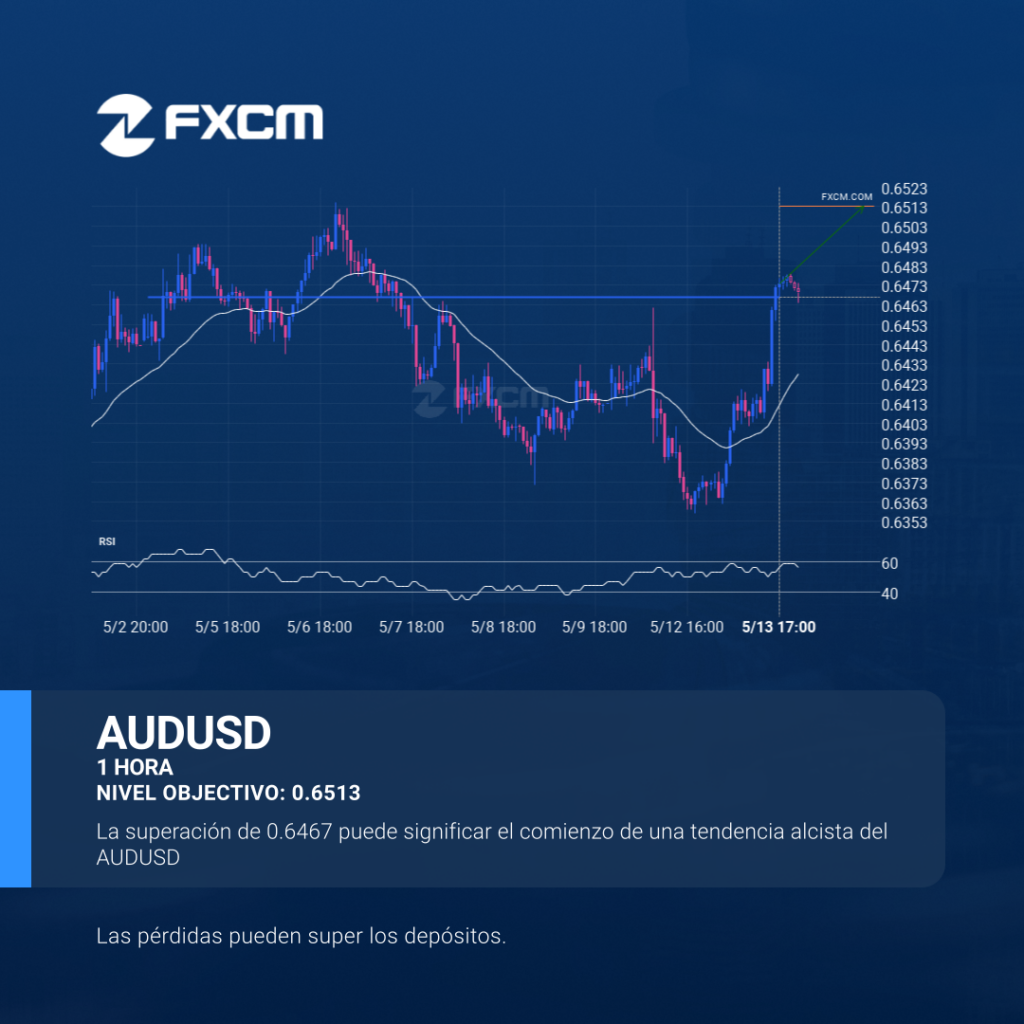
El precio de AUDUSD en dirección a 0.6513. A pesar de la reciente rotura a través de 0.6467, es posible que tenga dificultades para ganar impulso hacia el precio previsto y que retroceda en la otra dirección. Esto ha sucedido muchas veces en el pasado, así que esté atento a un posible rebote. El rendimiento […]
AUDUSD – resistance line broken at 2025-05-13T18:00:00.000Z
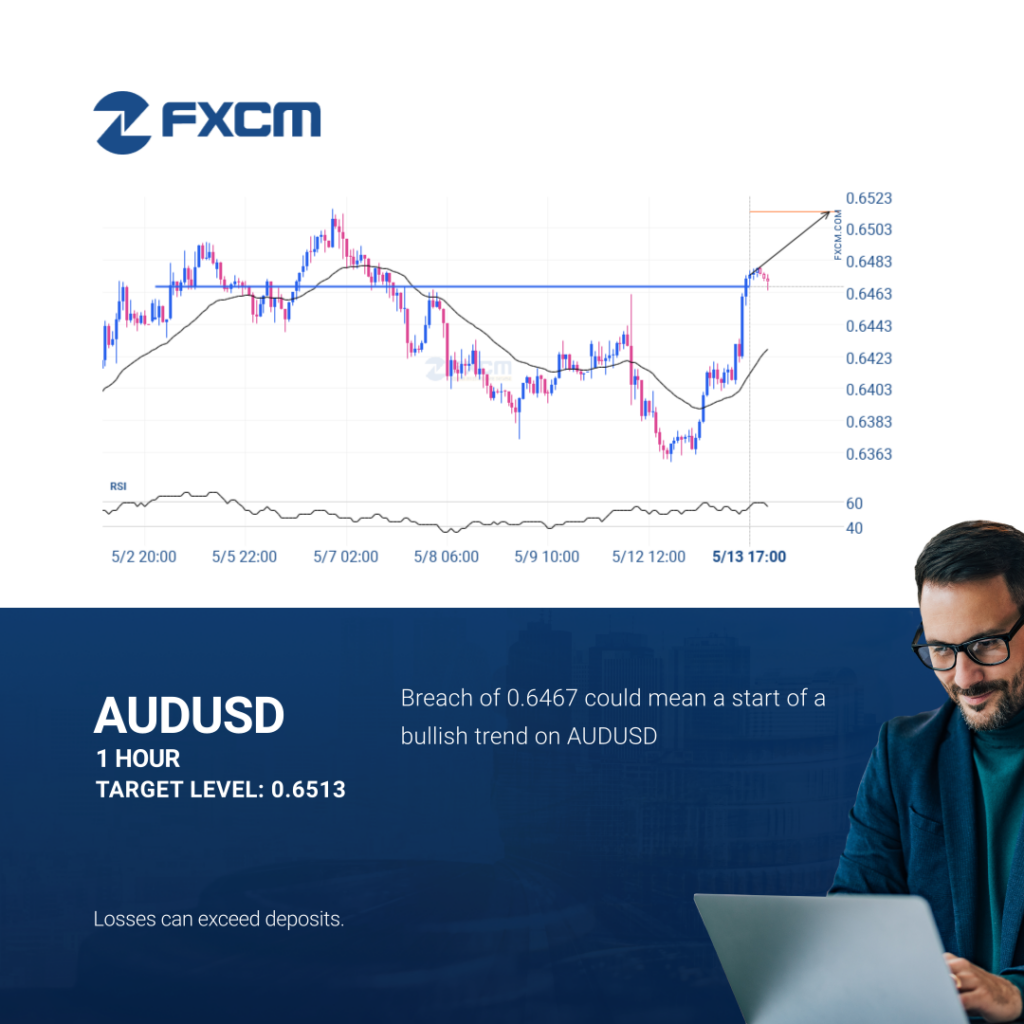
The price of AUDUSD in heading in the direction of 0.6513. Despite the recent breakout through 0.6467 it is possible that it will struggle to gain momentum to the forecast price and move back in the other direction. This has happened many times in the past so watch for a possible bounce back. Past performance […]
EURUSD was on its way down
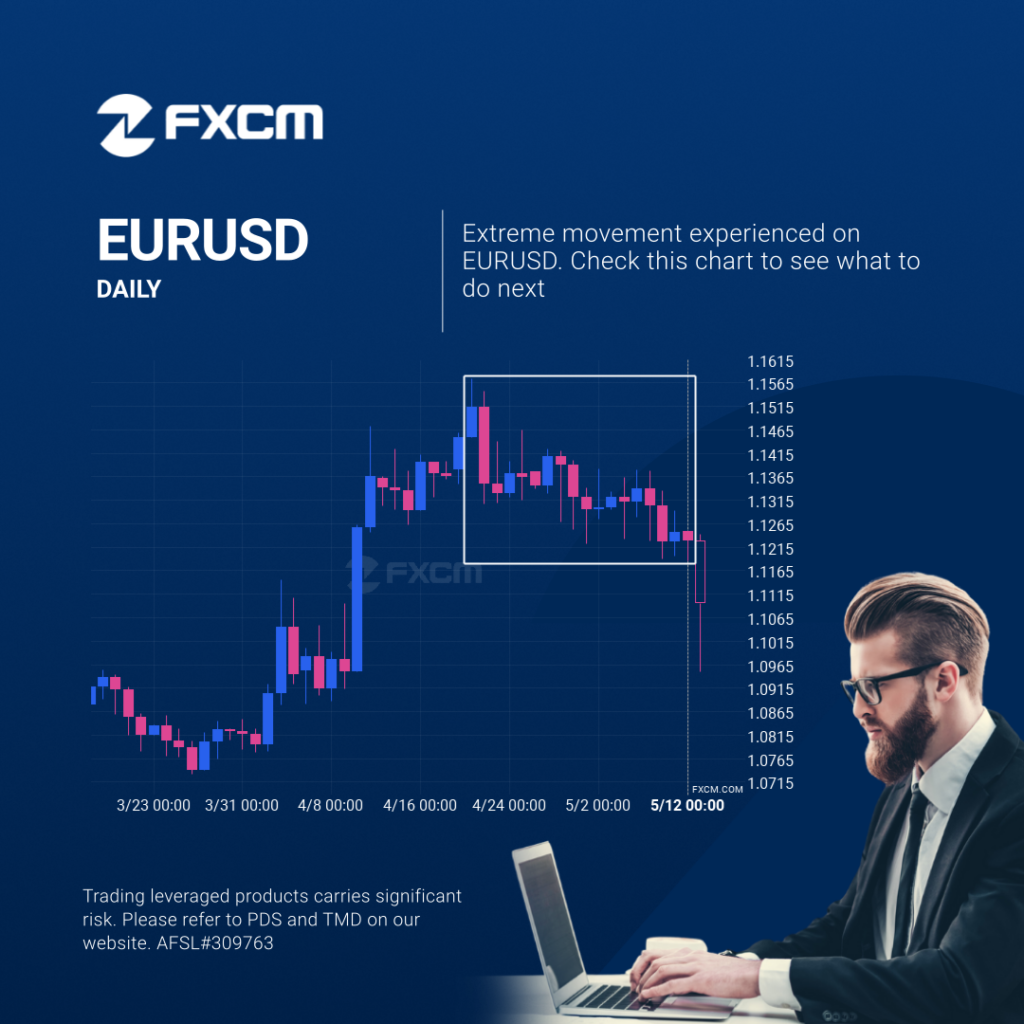
EURUSD experienced an extremely large move that lasted 22. This movement is in the 5.0 percentile and is uncommon. It is not unusual to witness a pullback after such a big movement. Past performance is not an indicator of future results. Trading leveraged products carries significant risk. Please refer to PDS and TMD on our […]
EURUSD fue hacia abajo

EURUSD experimentó un movimiento extremadamente grande que duró 22. Este movimiento está en el percentil 5.0 y es poco común. No es inusual presenciar un retroceso después de un movimiento tan grande. El rendimiento pasado no es indicativo de resultados futuros. Las pérdidas pueden exceder los fondos depositados.
EURUSD was on its way down
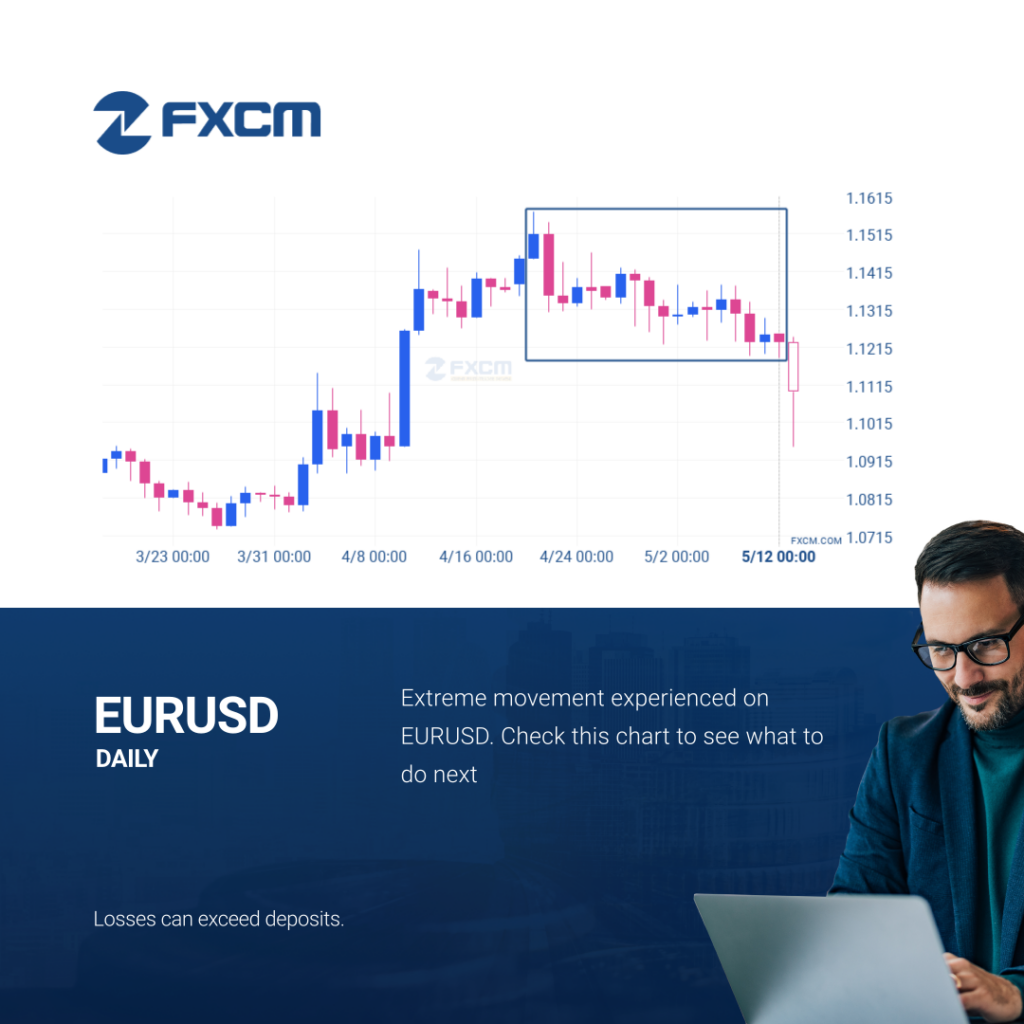
EURUSD experienced an extremely large move that lasted 22. This movement is in the 5.0 percentile and is uncommon. It is not unusual to witness a pullback after such a big movement. Past performance is not an indicator of future results. Losses can exceed deposits.
A potential bearish movement on USDJPY
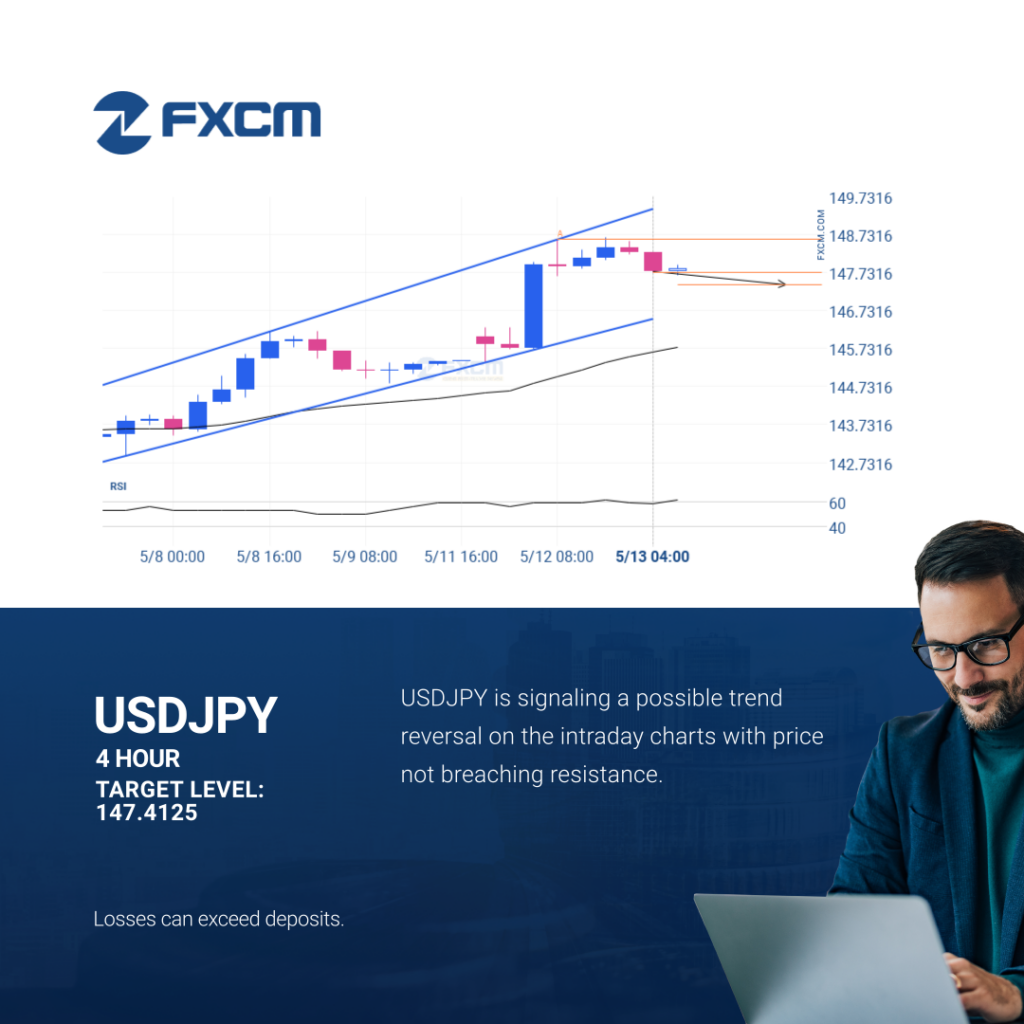
A Flag pattern was identified on USDJPY at 147.732, creating an expectation that it may move to the support line at 147.4125. It may break through that line and continue the bearish trend or it may reverse from that line. Past performance is not an indicator of future results. Losses can exceed deposits.
A final push possible on HKG33
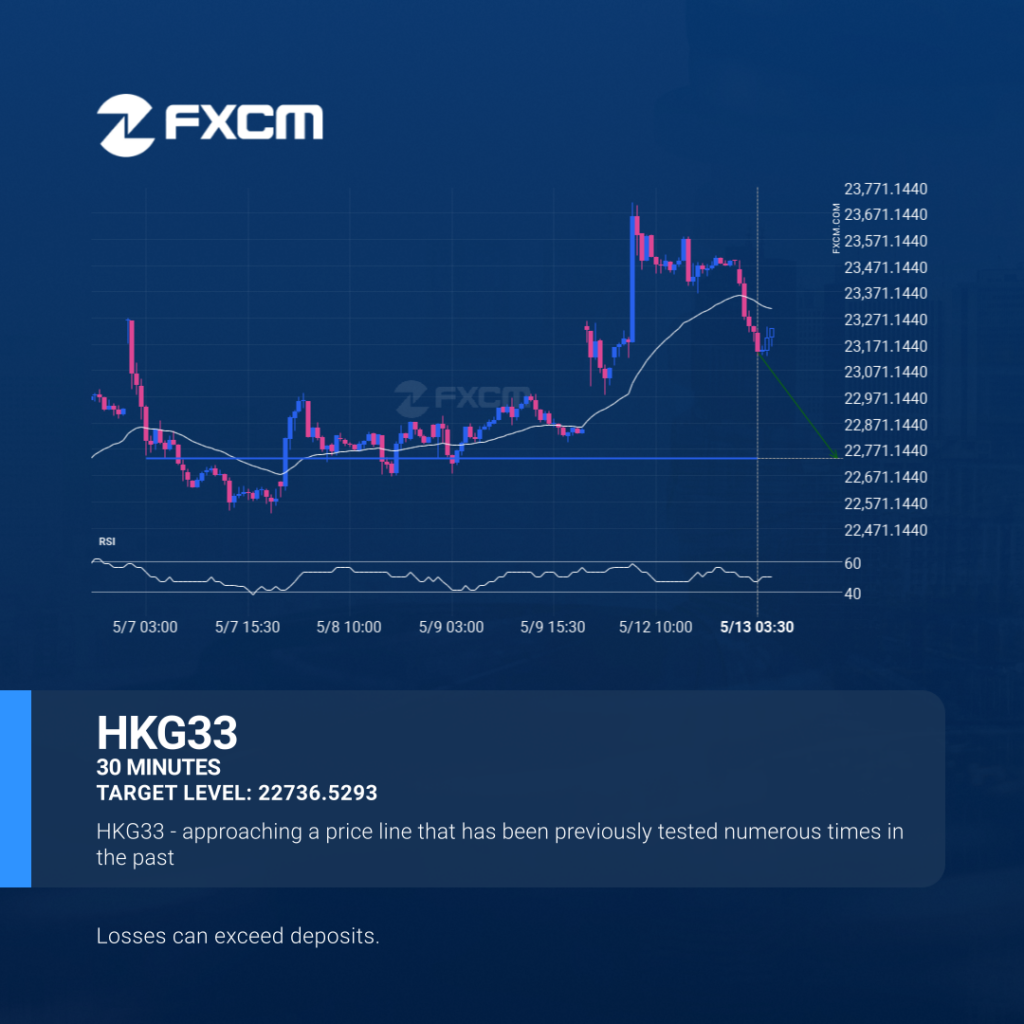
A strong support level has been identified at 22736.5293 on the 30 Minutes HKG33 chart. HKG33 is likely to test it soon. Past performance is not an indicator of future results. Losses can exceed deposits.
Un posible impulso final en el HKG33
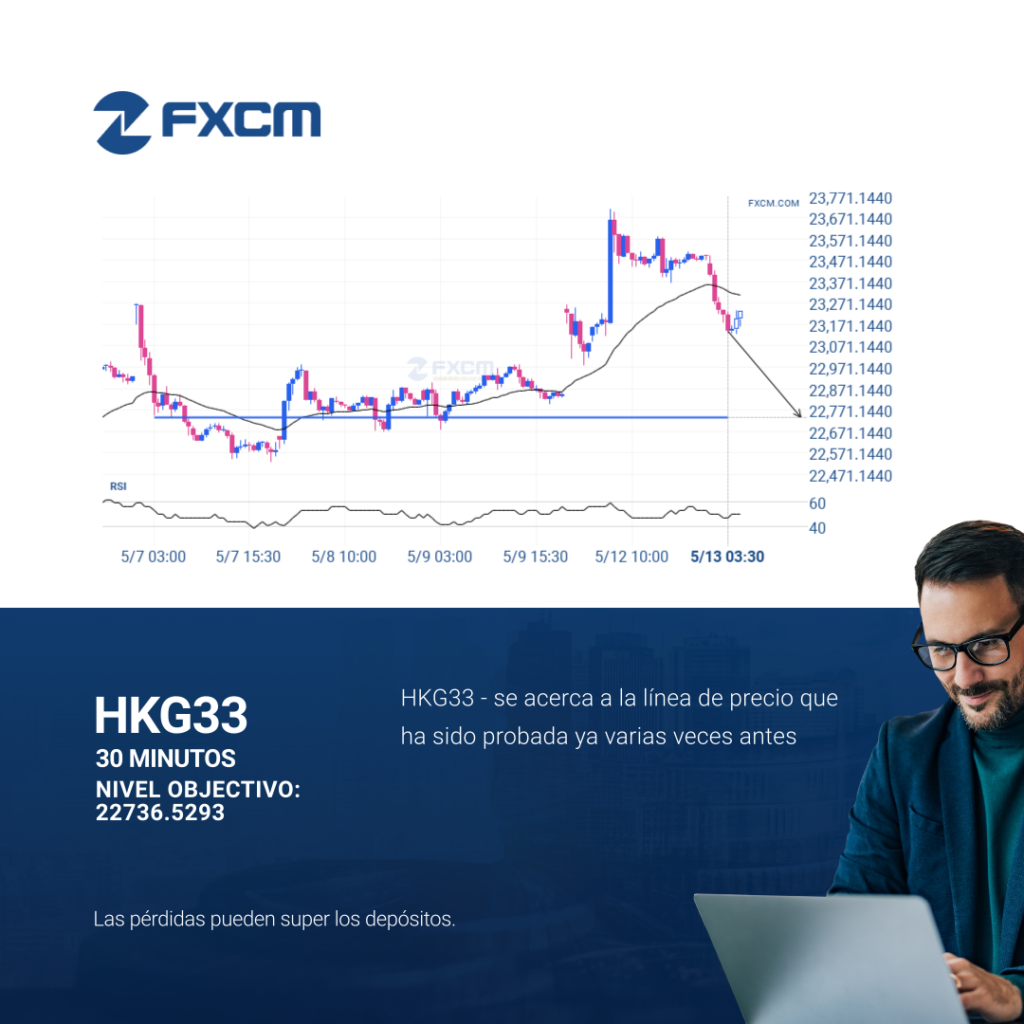
Se identificó un fuerte nivel de soporte en 22736.5293 en el gráfico de 30 Minutos de HKG33. Es probable que HKG33 lo testee pronto. El rendimiento pasado no es indicativo de resultados futuros. Las pérdidas pueden exceder los fondos depositados.