Análisis Técnico Forex
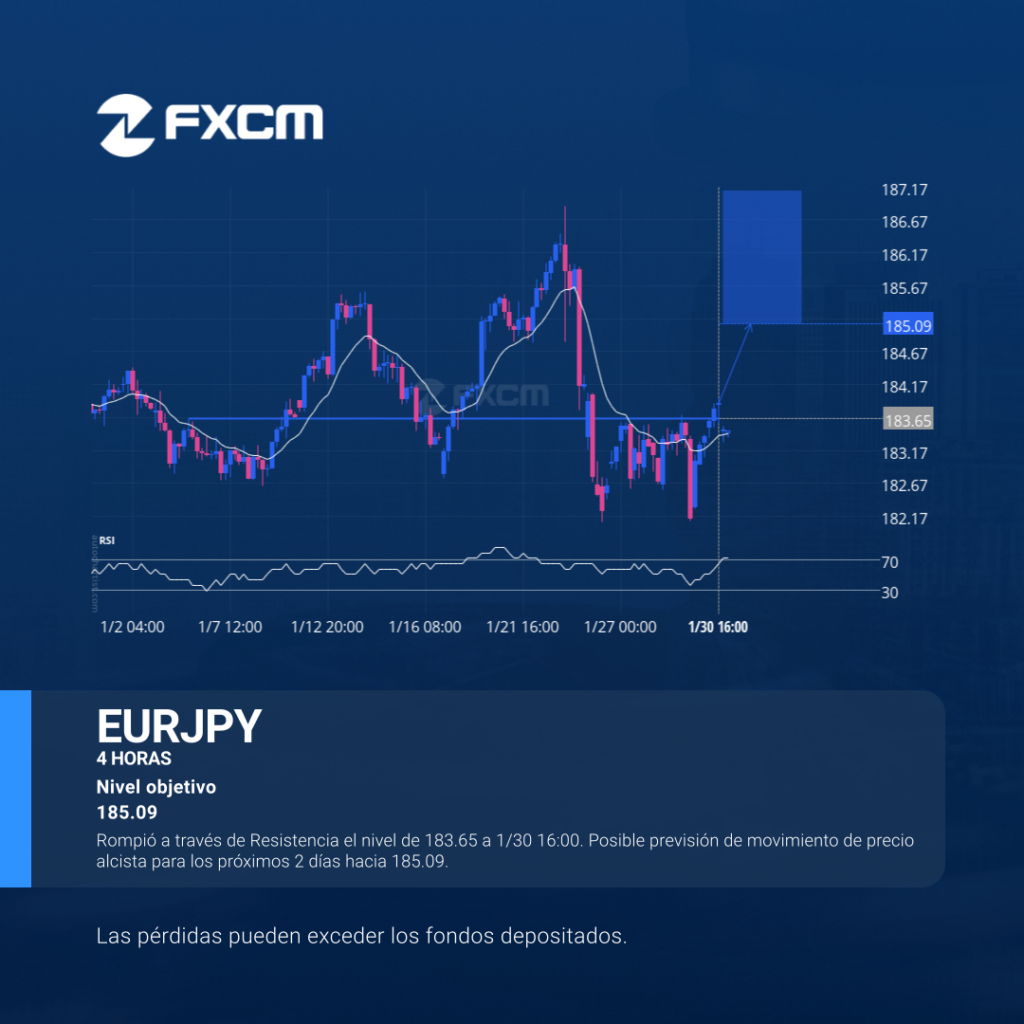
Rompió a través de Resistencia el nivel de 183.65 a 1/30 16:00. Posible previsión de movimiento de precio alcista para los próximos 2 días hacia 185.09. El rendimiento pasado no es indicativo de resultados futuros. Las pérdidas pueden exceder los depósitos.
Technical Analysis Indices
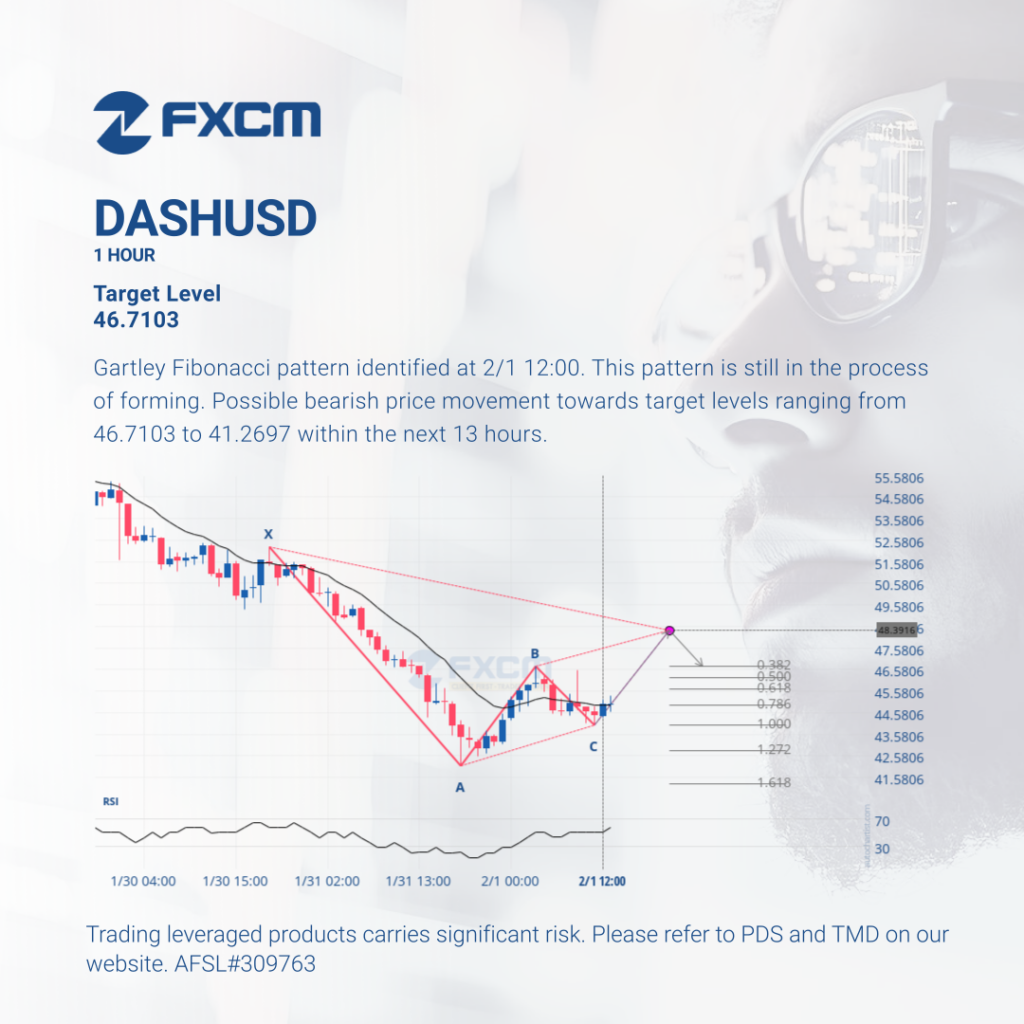
Gartley Fibonacci pattern identified at 2/1 12:00. This pattern is still in the process of forming. Possible bearish price movement towards target levels ranging from 46.7103 to 41.2697 within the next 13 hours. Past performance is not an indicator of future results. Trading leveraged products carries significant risk. Please refer to PDS and TMD on […]
Análisis Técnico Cripto
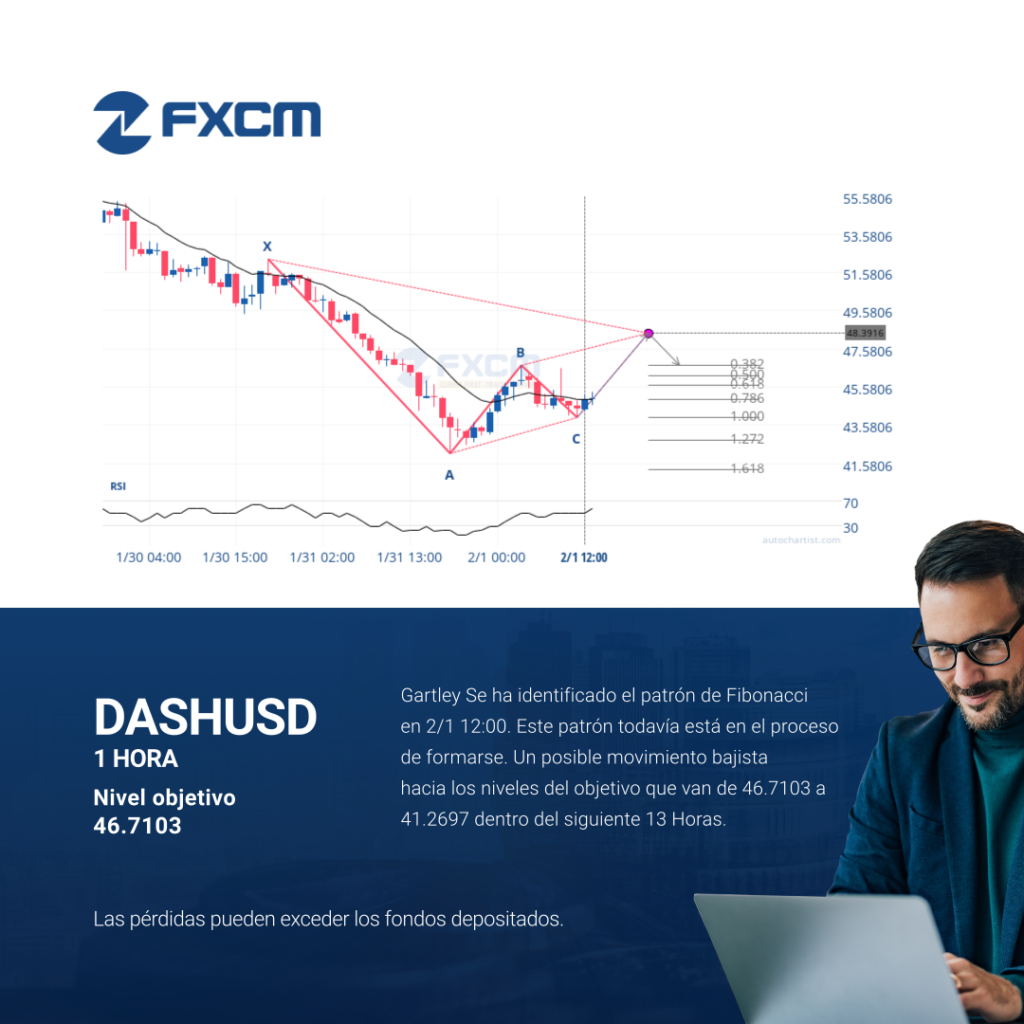
Gartley Se ha identificado el patrón de Fibonacci en 2/1 12:00. Este patrón todavía está en el proceso de formarse. Un posible movimiento bajista hacia los niveles del objetivo que van de 46.7103 a 41.2697 dentro del siguiente 13 Horas. El rendimiento pasado no es indicativo de resultados futuros. Las pérdidas pueden exceder los depósitos.
Índices de Análisis Técnico
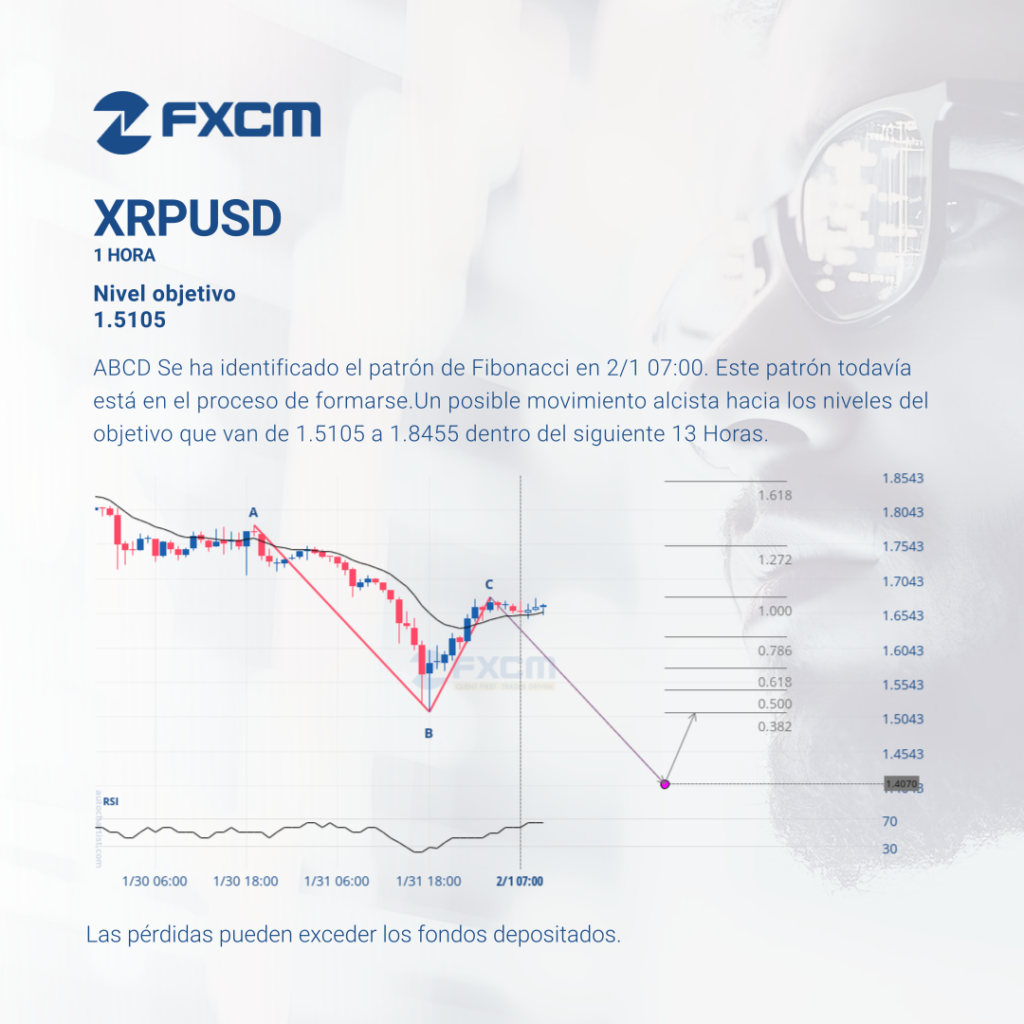
ABCD Se ha identificado el patrón de Fibonacci en 2/1 07:00. Este patrón todavía está en el proceso de formarse.Un posible movimiento alcista hacia los niveles del objetivo que van de 1.5105 a 1.8455 dentro del siguiente 13 Horas. Las pérdidas pueden exceder los depósitos.
Technical Analysis Indices
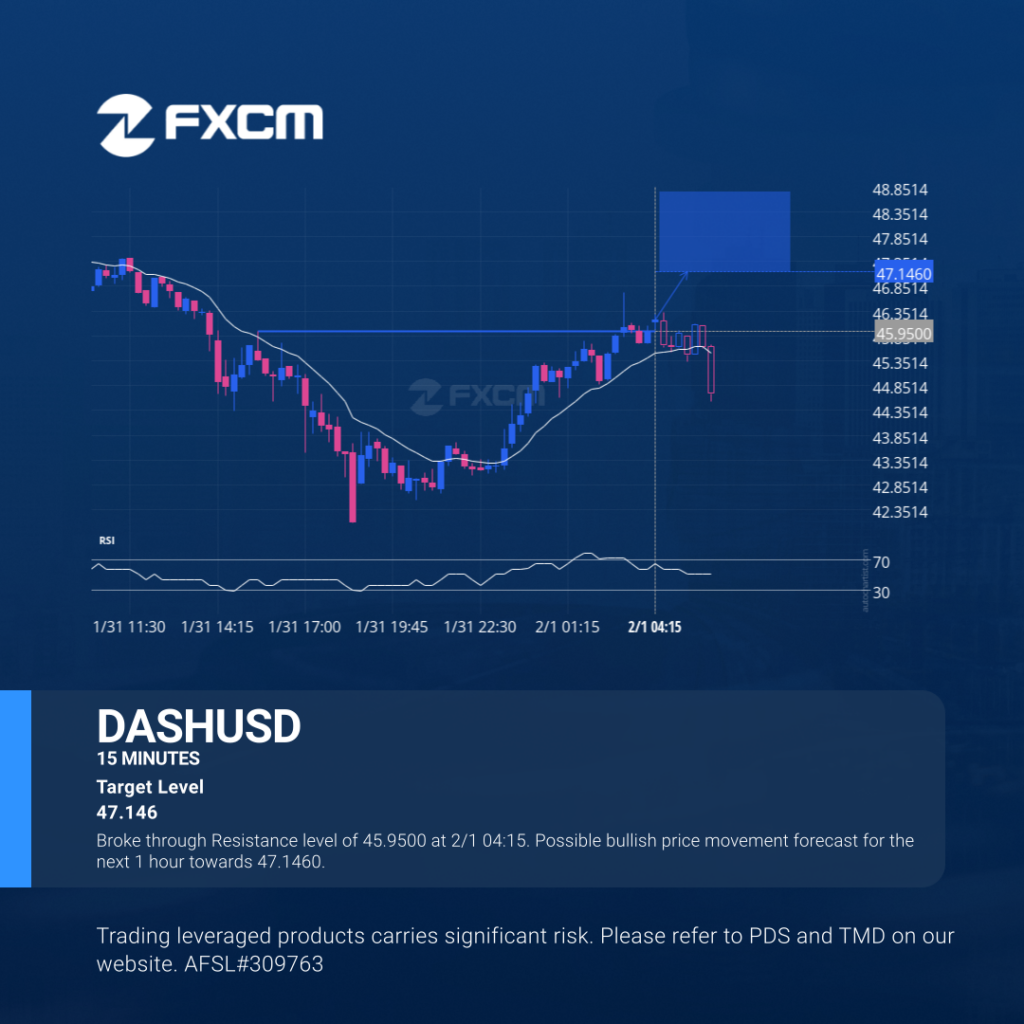
Broke through Resistance level of 45.9500 at 2/1 04:15. Possible bullish price movement forecast for the next 1 hour towards 47.1460. Past performance is not an indicator of future results. Trading leveraged products carries significant risk. Please refer to PDS and TMD on our website. AFSL#309763
Análisis Técnico Cripto
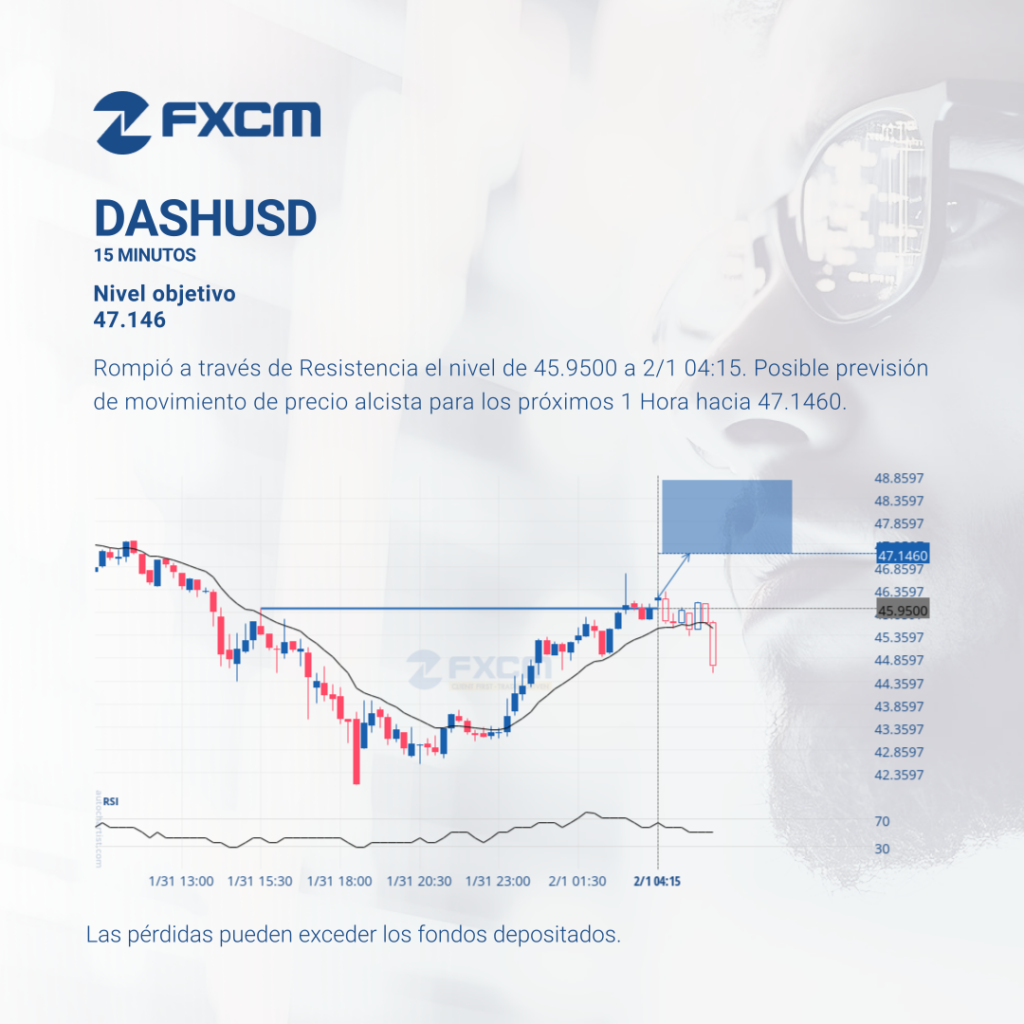
Rompió a través de Resistencia el nivel de 45.9500 a 2/1 04:15. Posible previsión de movimiento de precio alcista para los próximos 1 Hora hacia 47.1460. El rendimiento pasado no es indicativo de resultados futuros. Las pérdidas pueden exceder los depósitos.
Índices de Análisis Técnico
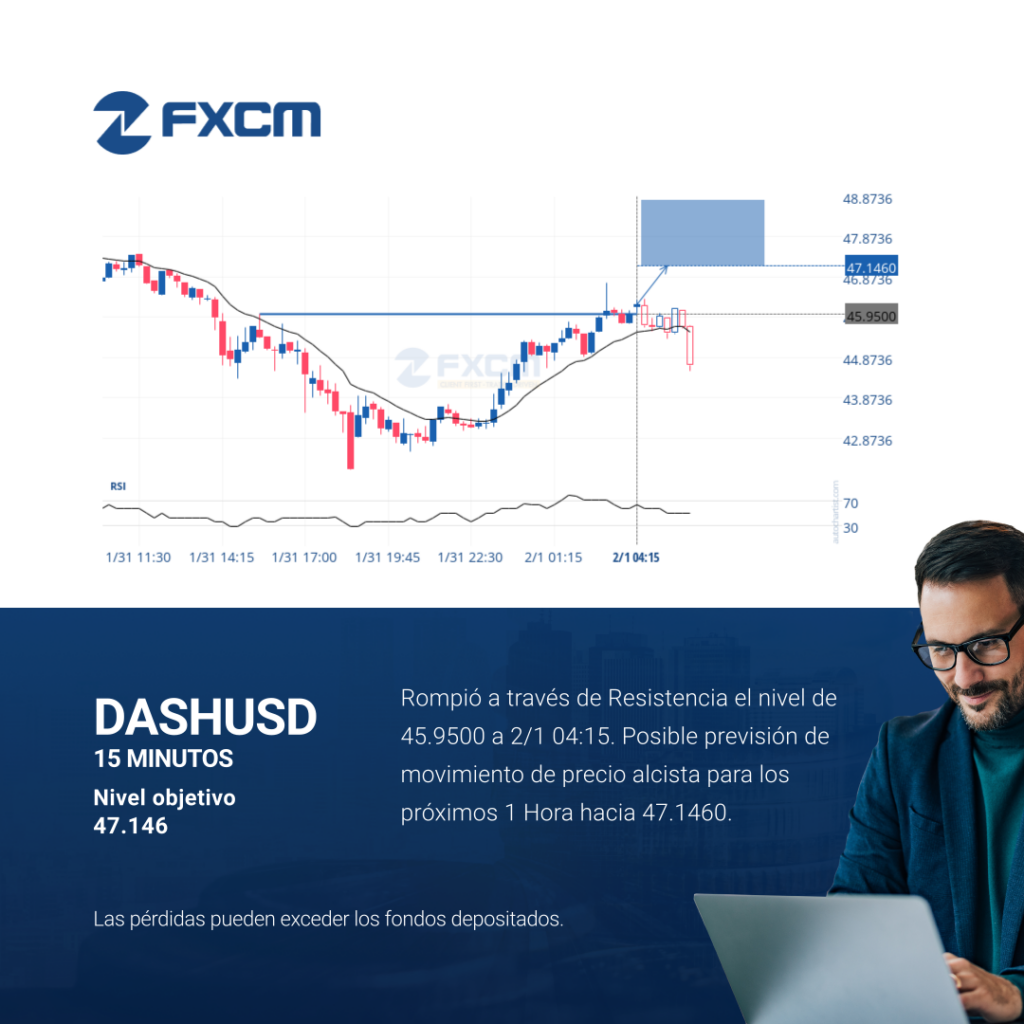
Rompió a través de Resistencia el nivel de 45.9500 a 2/1 04:15. Posible previsión de movimiento de precio alcista para los próximos 1 Hora hacia 47.1460. Las pérdidas pueden exceder los depósitos.
Análisis Técnico Cripto
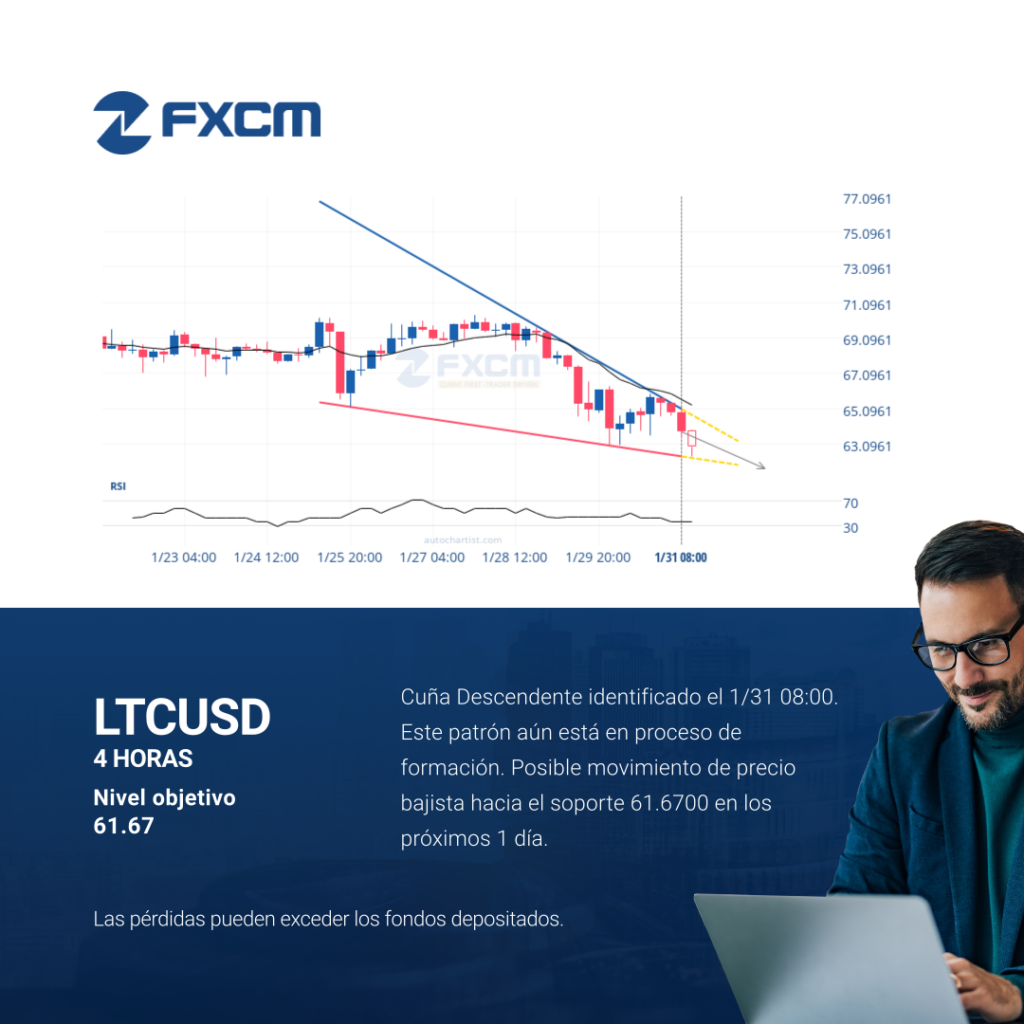
Cuña Descendente identificado el 1/31 08:00. Este patrón aún está en proceso de formación. Posible movimiento de precio bajista hacia el soporte 61.6700 en los próximos 1 día. El rendimiento pasado no es indicativo de resultados futuros. Las pérdidas pueden exceder los depósitos.
Índices de Análisis Técnico
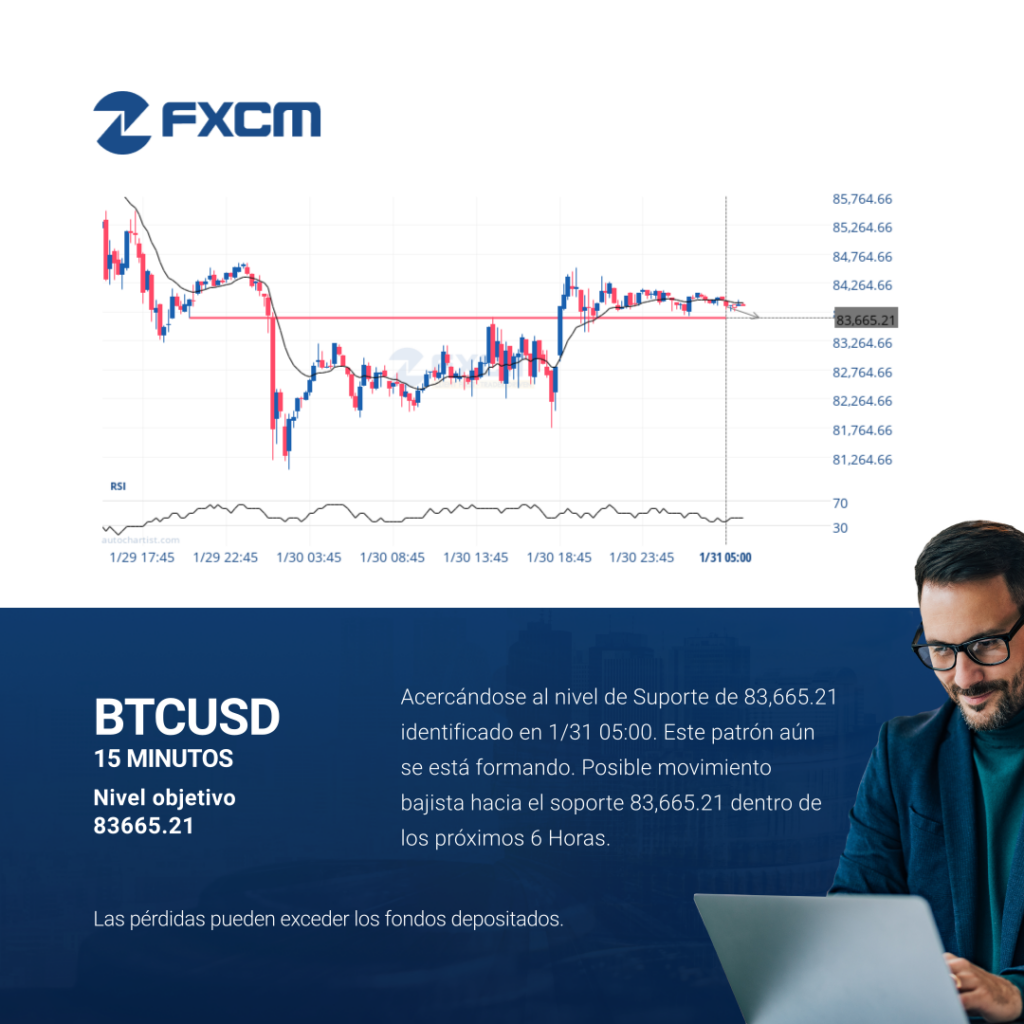
Acercándose al nivel de Suporte de 83,665.21 identificado en 1/31 05:00. Este patrón aún se está formando. Posible movimiento bajista hacia el soporte 83,665.21 dentro de los próximos 6 Horas. Las pérdidas pueden exceder los depósitos.
Technical Analysis Indices
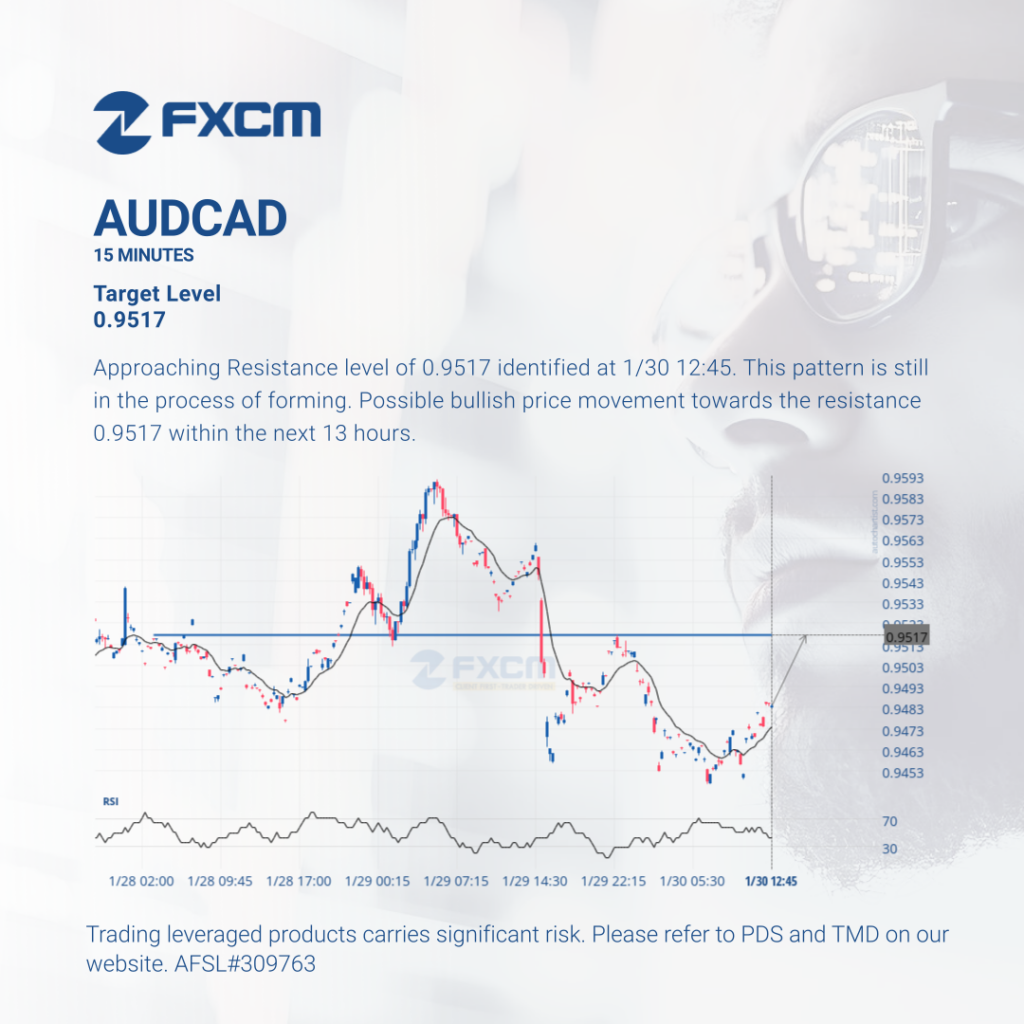
Approaching Resistance level of 0.9517 identified at 1/30 12:45. This pattern is still in the process of forming. Possible bullish price movement towards the resistance 0.9517 within the next 13 hours. Past performance is not an indicator of future results. Trading leveraged products carries significant risk. Please refer to PDS and TMD on our website. […]