Análisis Técnico Cripto
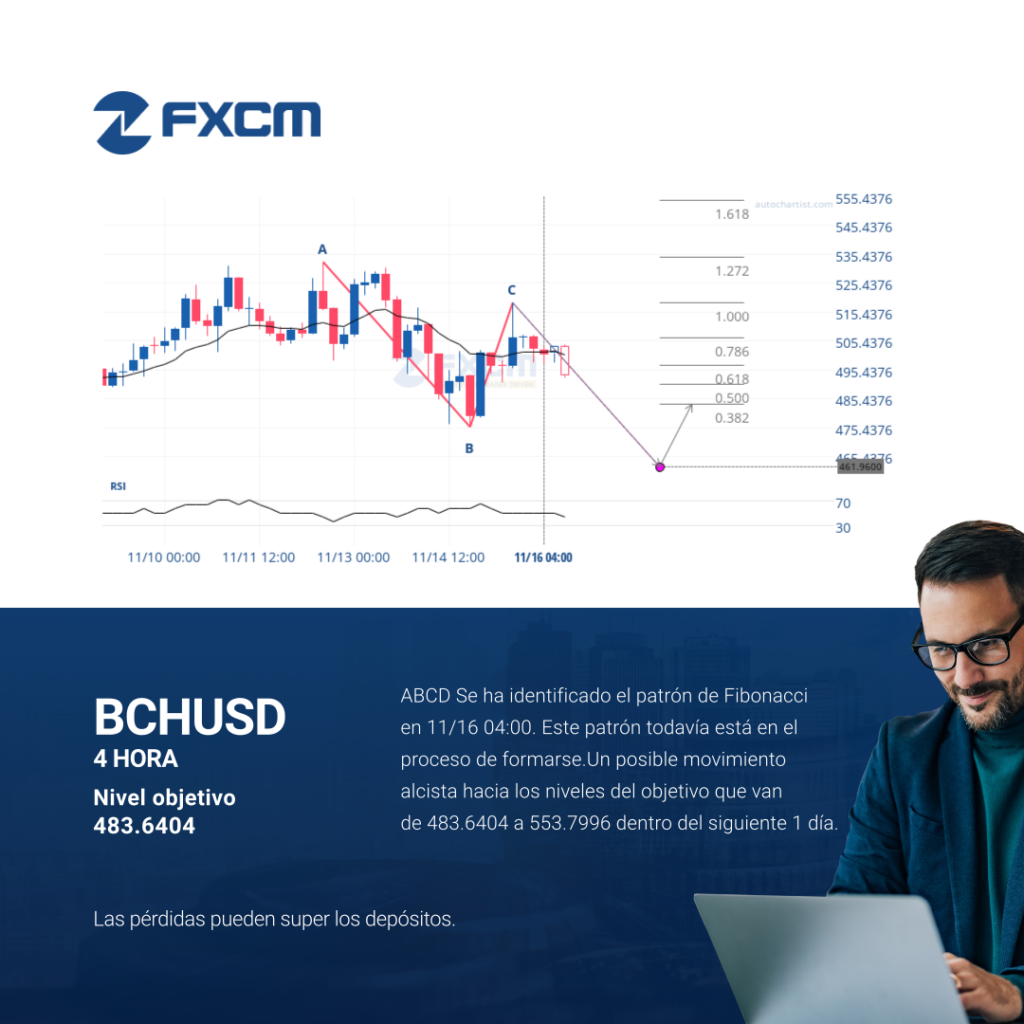
ABCD Se ha identificado el patrón de Fibonacci en 11/16 04:00. Este patrón todavía está en el proceso de formarse.Un posible movimiento alcista hacia los niveles del objetivo que van de 483.6404 a 553.7996 dentro del siguiente 1 día. El rendimiento pasado no es indicativo de resultados futuros. Las pérdidas pueden exceder los fondos depositados.
Technical Analysis Indices
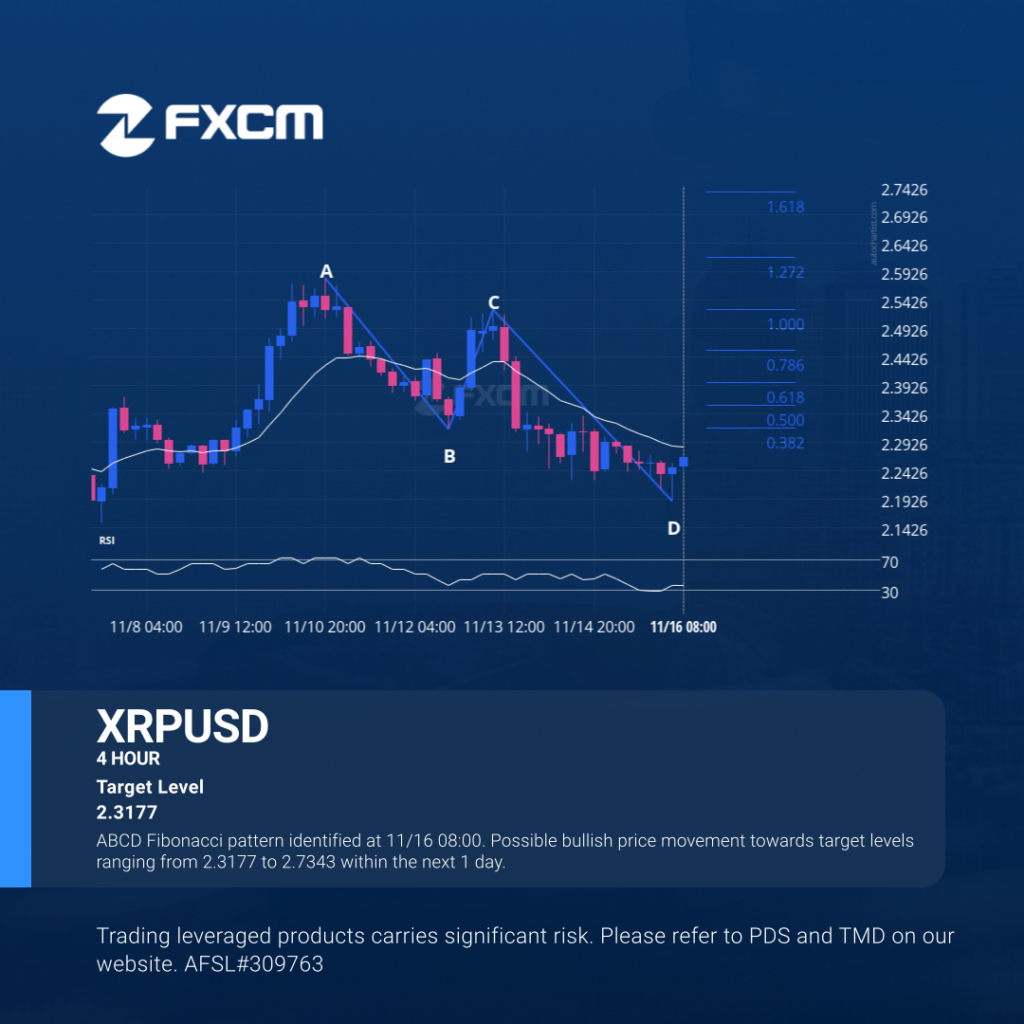
ABCD Fibonacci pattern identified at 11/16 08:00. Possible bullish price movement towards target levels ranging from 2.3177 to 2.7343 within the next 1 day. Past performance is not an indicator of future results. Trading leveraged products carries significant risk. Please refer to PDS and TMD on our website. AFSL#309763
Análisis Técnico Cripto
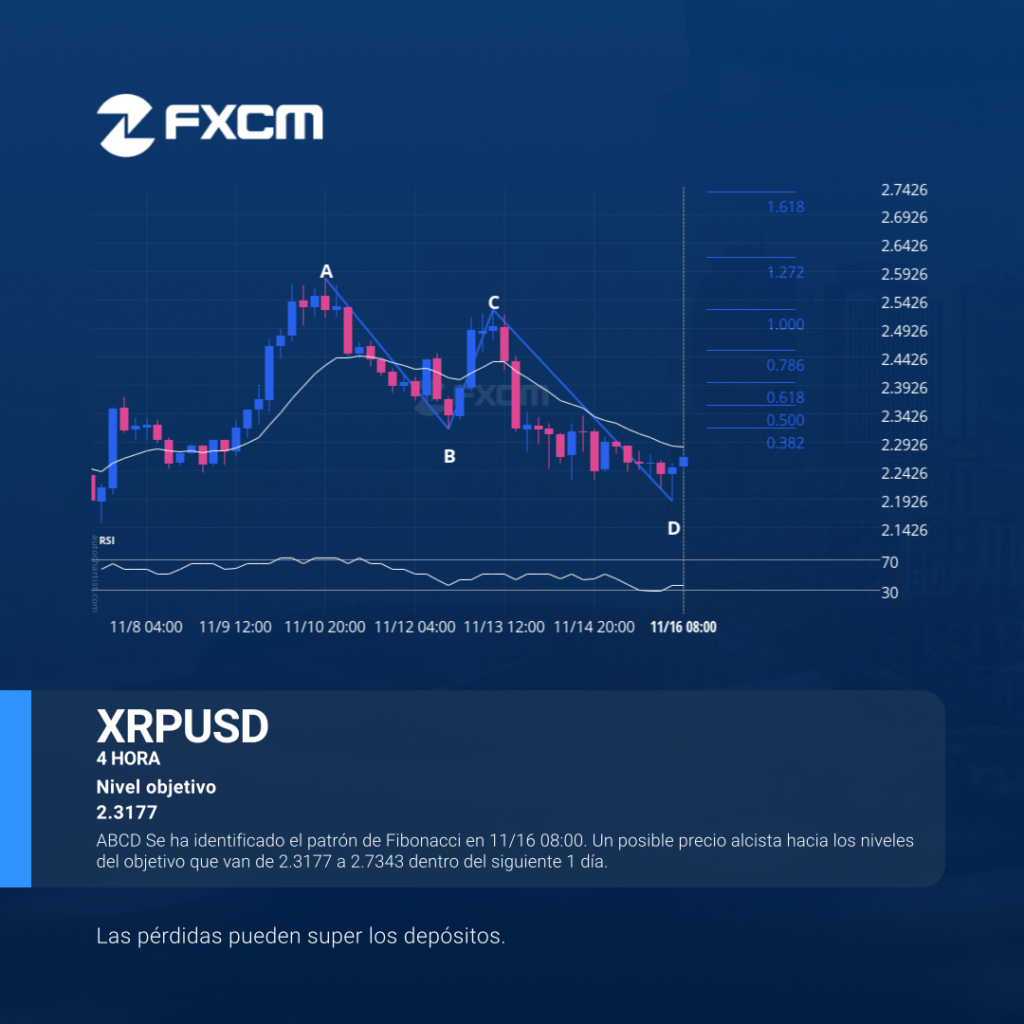
ABCD Se ha identificado el patrón de Fibonacci en 11/16 08:00. Un posible precio alcista hacia los niveles del objetivo que van de 2.3177 a 2.7343 dentro del siguiente 1 día. El rendimiento pasado no es indicativo de resultados futuros. Las pérdidas pueden exceder los fondos depositados.
Technical Analysis Forex
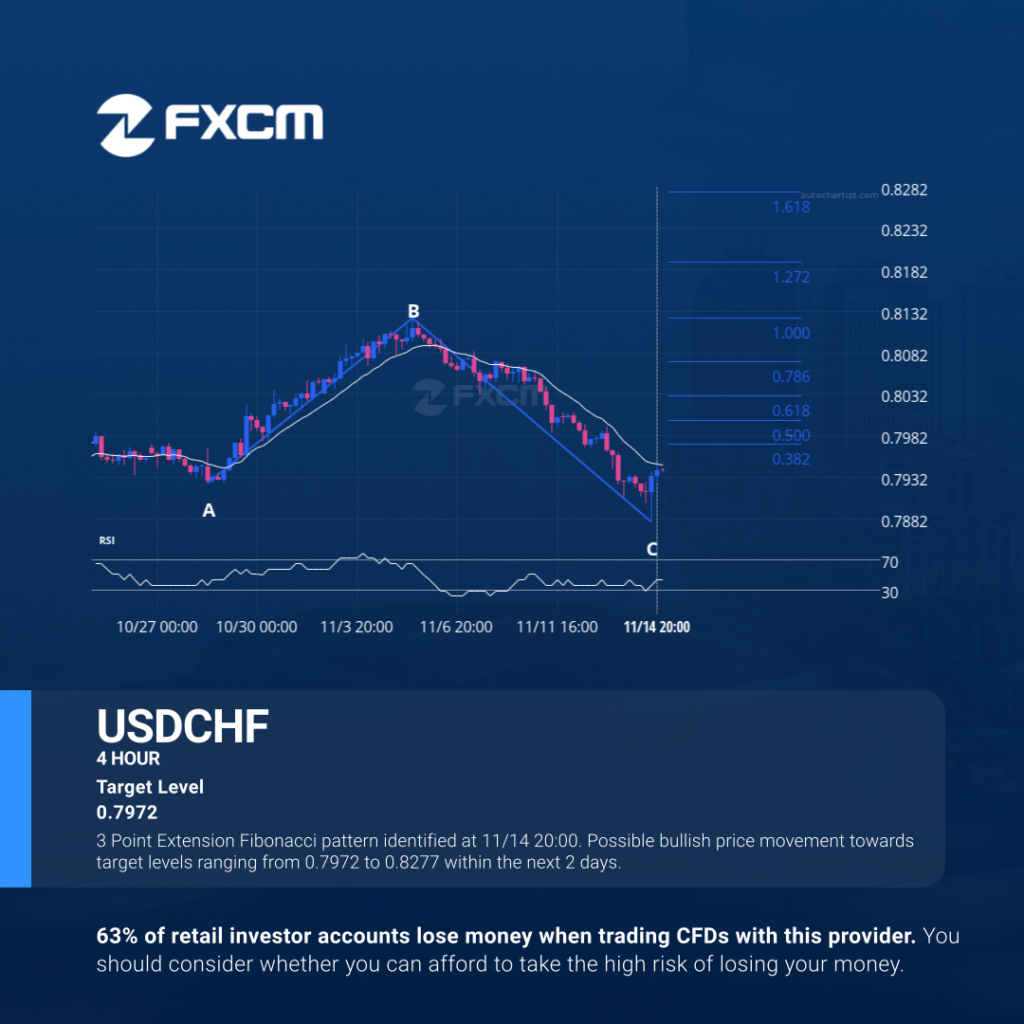
3 Point Extension Fibonacci pattern identified at 11/14 20:00. Possible bullish price movement towards target levels ranging from 0.7972 to 0.8277 within the next 2 days. Past performance is not an indicator of future results. Losses can exceed deposits.
Índices de Análisis Técnico
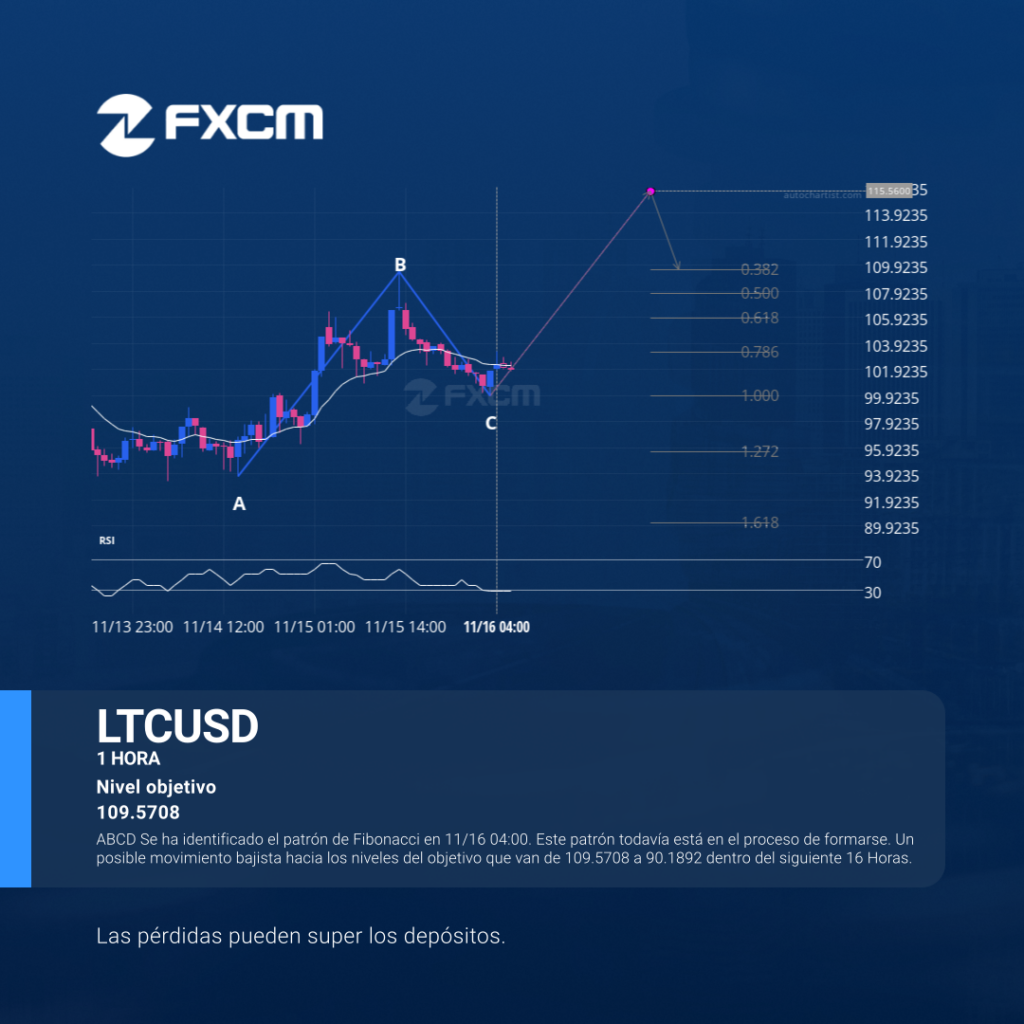
ABCD Se ha identificado el patrón de Fibonacci en 11/16 04:00. Este patrón todavía está en el proceso de formarse. Un posible movimiento bajista hacia los niveles del objetivo que van de 109.5708 a 90.1892 dentro del siguiente 16 Horas. El rendimiento pasado no es indicativo de resultados futuros. Las pérdidas pueden exceder los fondos depositados.
Índices de Análisis Técnico
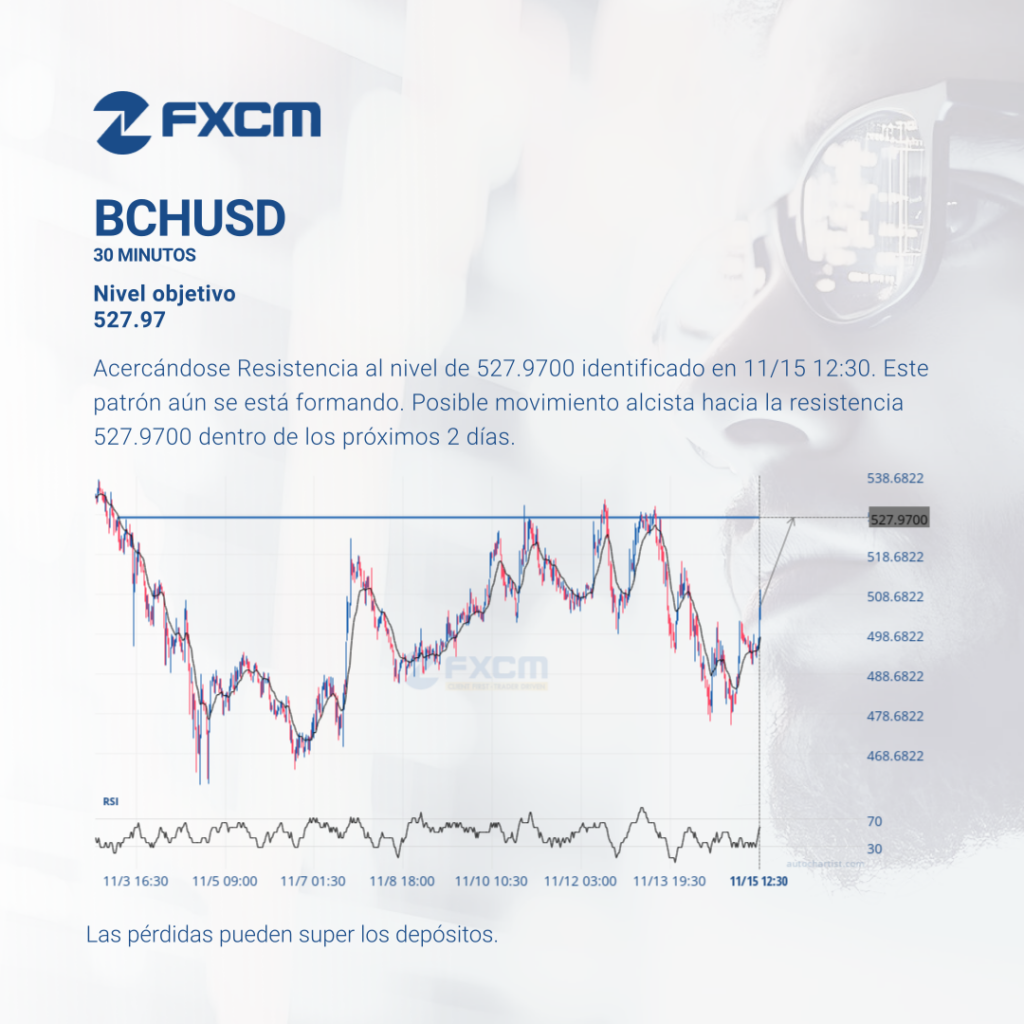
Acercándose Resistencia al nivel de 527.9700 identificado en 11/15 12:30. Este patrón aún se está formando. Posible movimiento alcista hacia la resistencia 527.9700 dentro de los próximos 2 días. El rendimiento pasado no es indicativo de resultados futuros. Las pérdidas pueden exceder los fondos depositados.
Technical Analysis Indices

Approaching Resistance level of 527.9700 identified at 11/15 12:30. This pattern is still in the process of forming. Possible bullish price movement towards the resistance 527.9700 within the next 2 days. Past performance is not an indicator of future results. Trading leveraged products carries significant risk. Please refer to PDS and TMD on our website. […]
Technical Analysis Forex
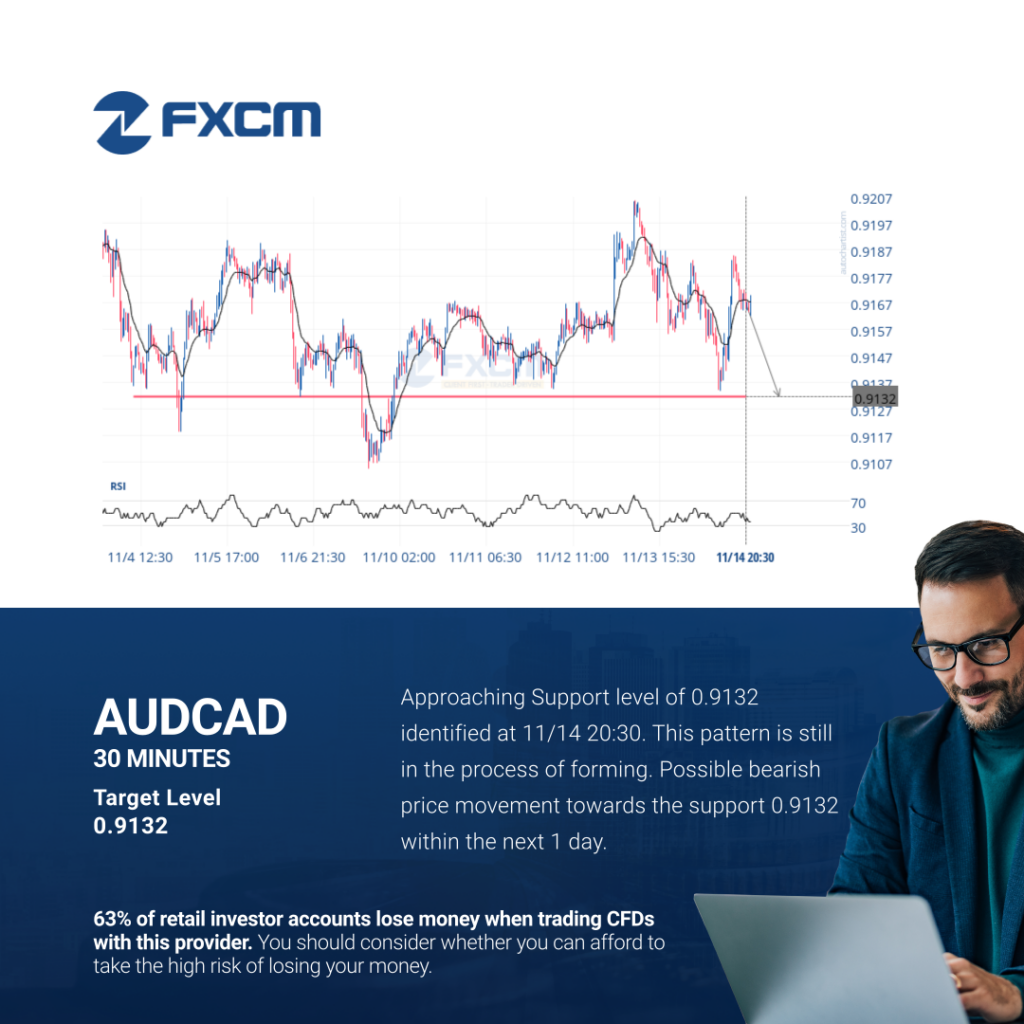
Approaching Support level of 0.9132 identified at 11/14 20:30. This pattern is still in the process of forming. Possible bearish price movement towards the support 0.9132 within the next 1 day. Past performance is not an indicator of future results. Losses can exceed deposits.
Índices de Análisis Técnico
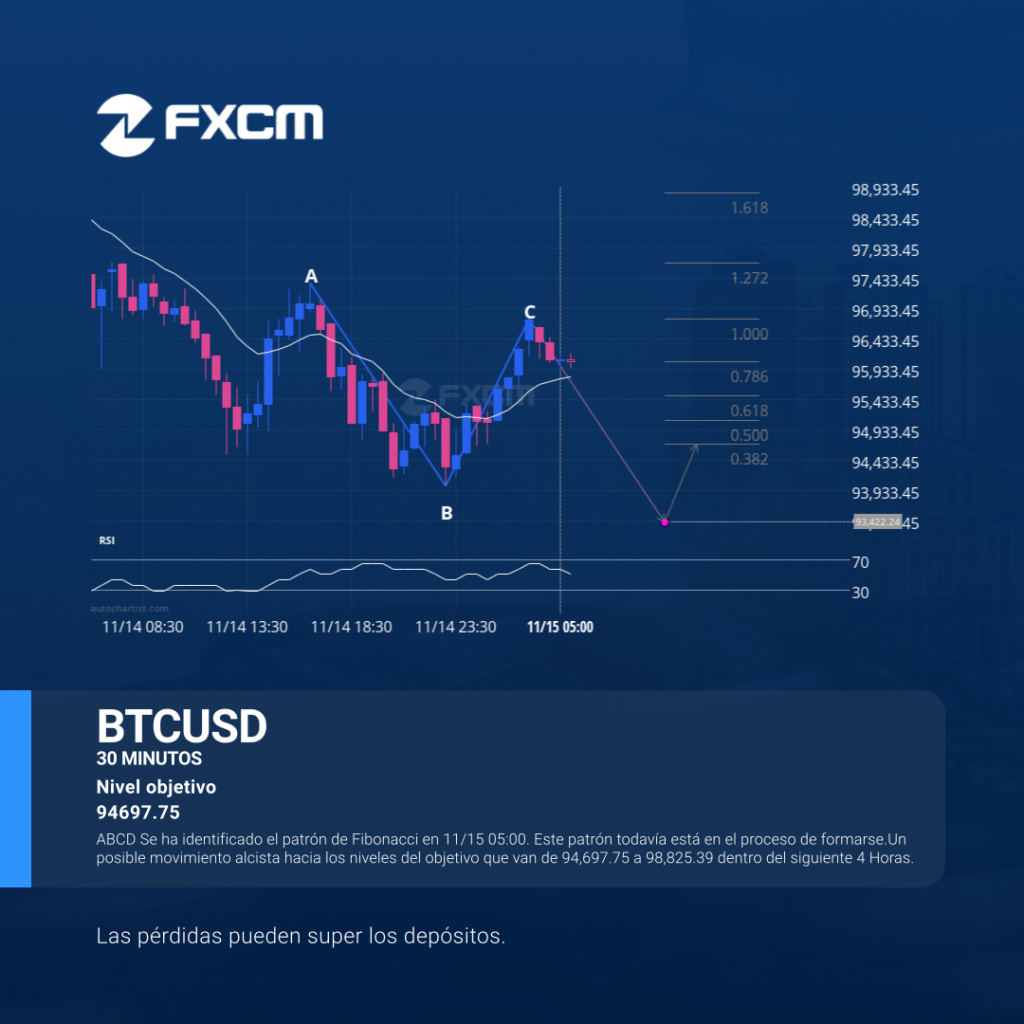
ABCD Se ha identificado el patrón de Fibonacci en 11/15 05:00. Este patrón todavía está en el proceso de formarse.Un posible movimiento alcista hacia los niveles del objetivo que van de 94,697.75 a 98,825.39 dentro del siguiente 4 Horas. El rendimiento pasado no es indicativo de resultados futuros. Las pérdidas pueden exceder los fondos depositados.
Technical Analysis Forex
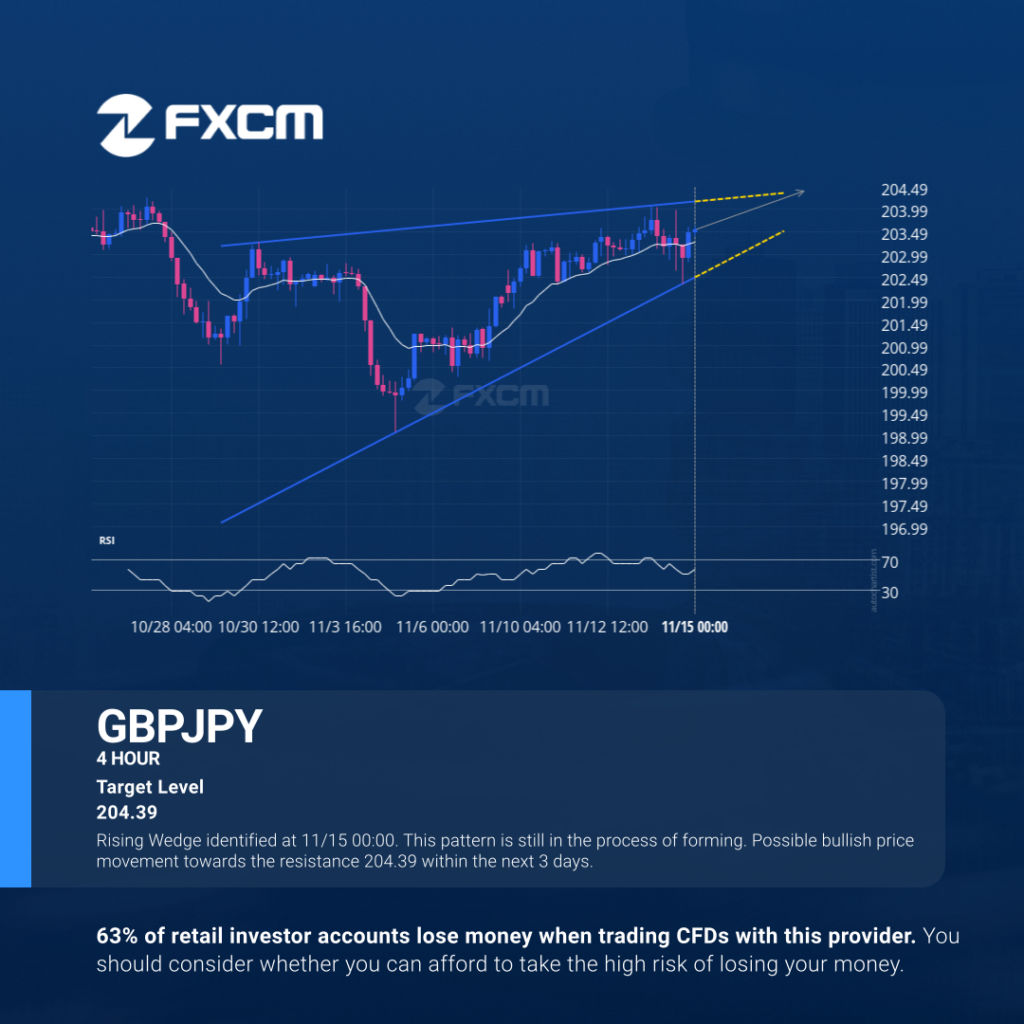
Rising Wedge identified at 11/15 00:00. This pattern is still in the process of forming. Possible bullish price movement towards the resistance 204.39 within the next 3 days. Past performance is not an indicator of future results. Losses can exceed deposits.