A potential bearish movement on HKG33
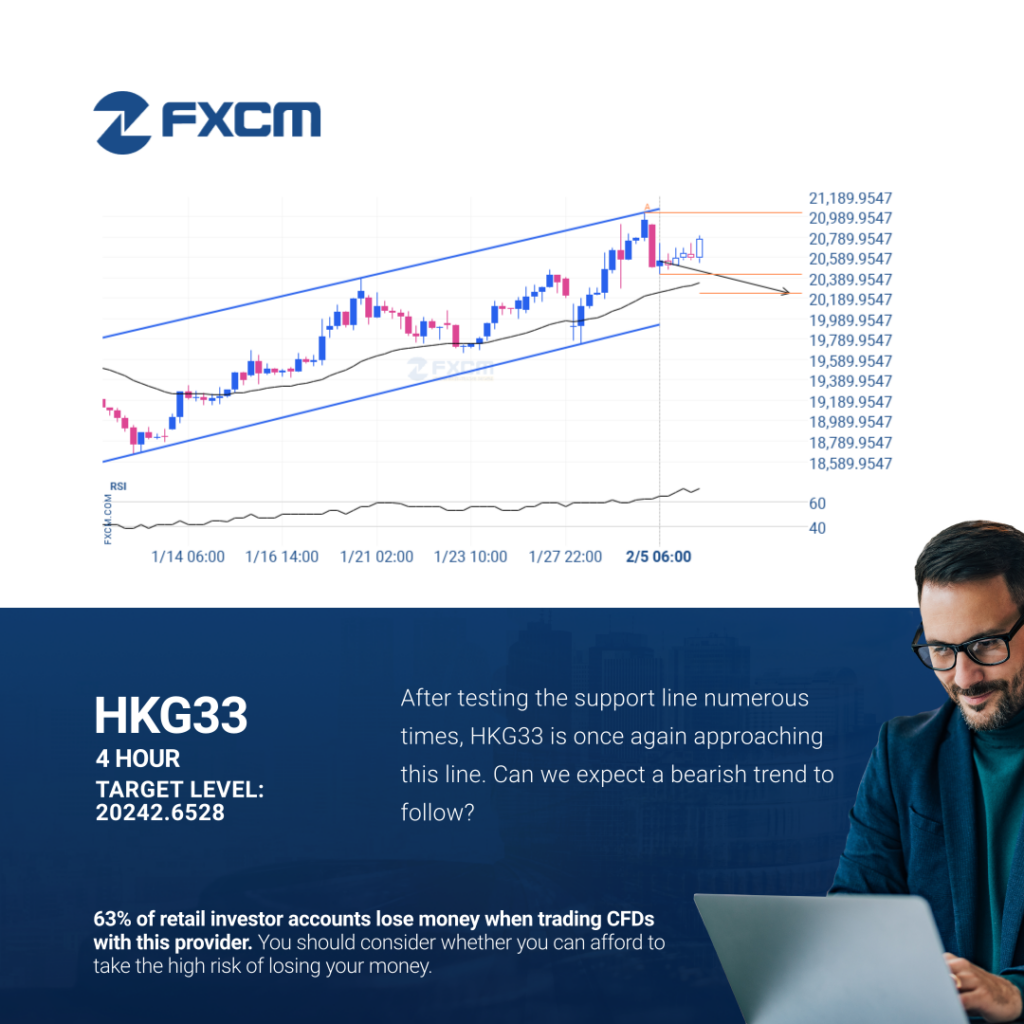
HKG33 is approaching the support line of a Channel Up. It has touched this line numerous times in the last 38 days. If it tests this line again, it should do so in the next 3 days. Past performance is not an indicator of future results. 64% of retail investor accounts lose money when trading […]
Un posible movimiento bajista en HKG33
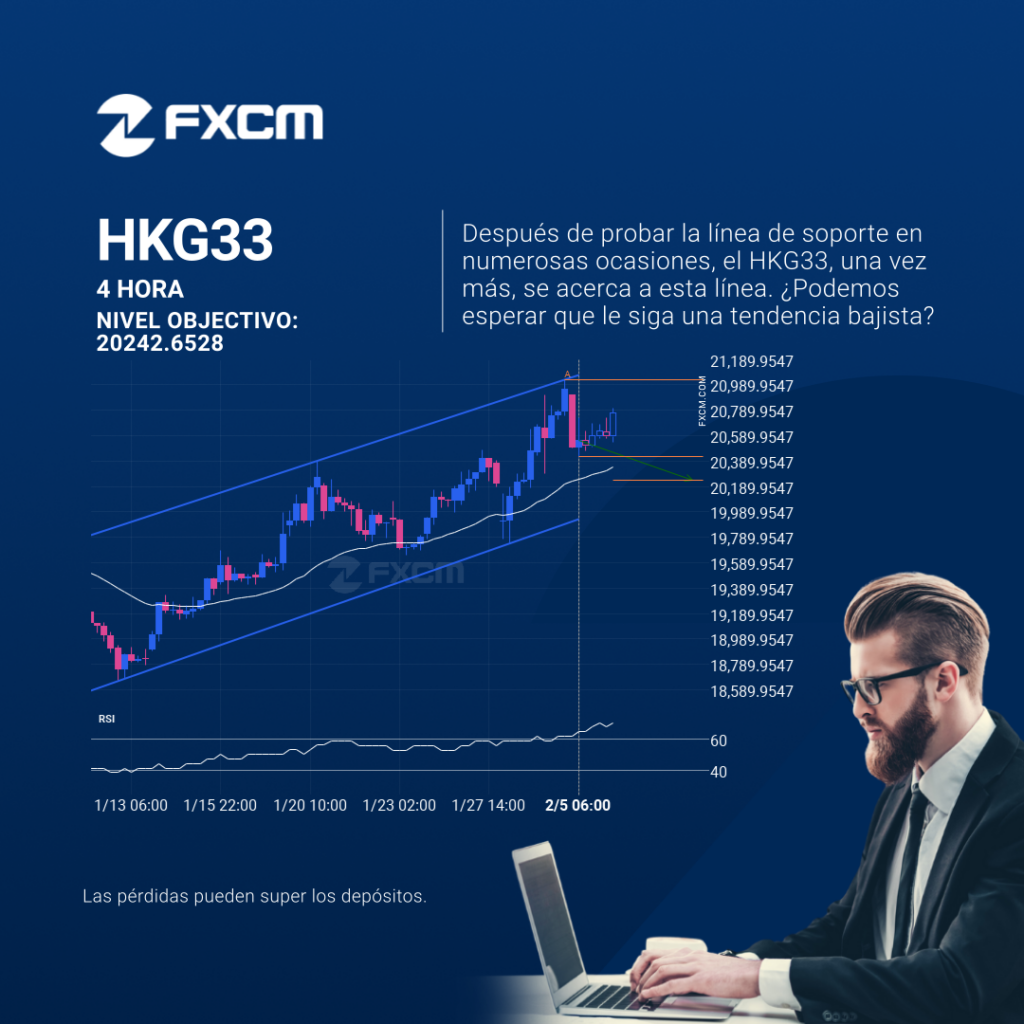
El HKG33 se está acercando a la línea de soporte de un Canal alcista. Ha llegado a esta línea en numerosas ocasiones durante los últimos 38 días. Si vuelve a probarla de nuevo, debería hacerlo en las próximas 3 días. El rendimiento pasado no es indicativo de resultados futuros. Las pérdidas pueden exceder los fondos […]
EURGBP was on its way down

For those of you that don’t believe in trends, this may be an opportunity to take advantage of an exceptional 1.57% move on EURGBP. The movement has happened over the last 18 days. For those trend followers among you, you may think about riding this possible trend. Past performance is not an indicator of future […]
EURGBP fue hacia abajo
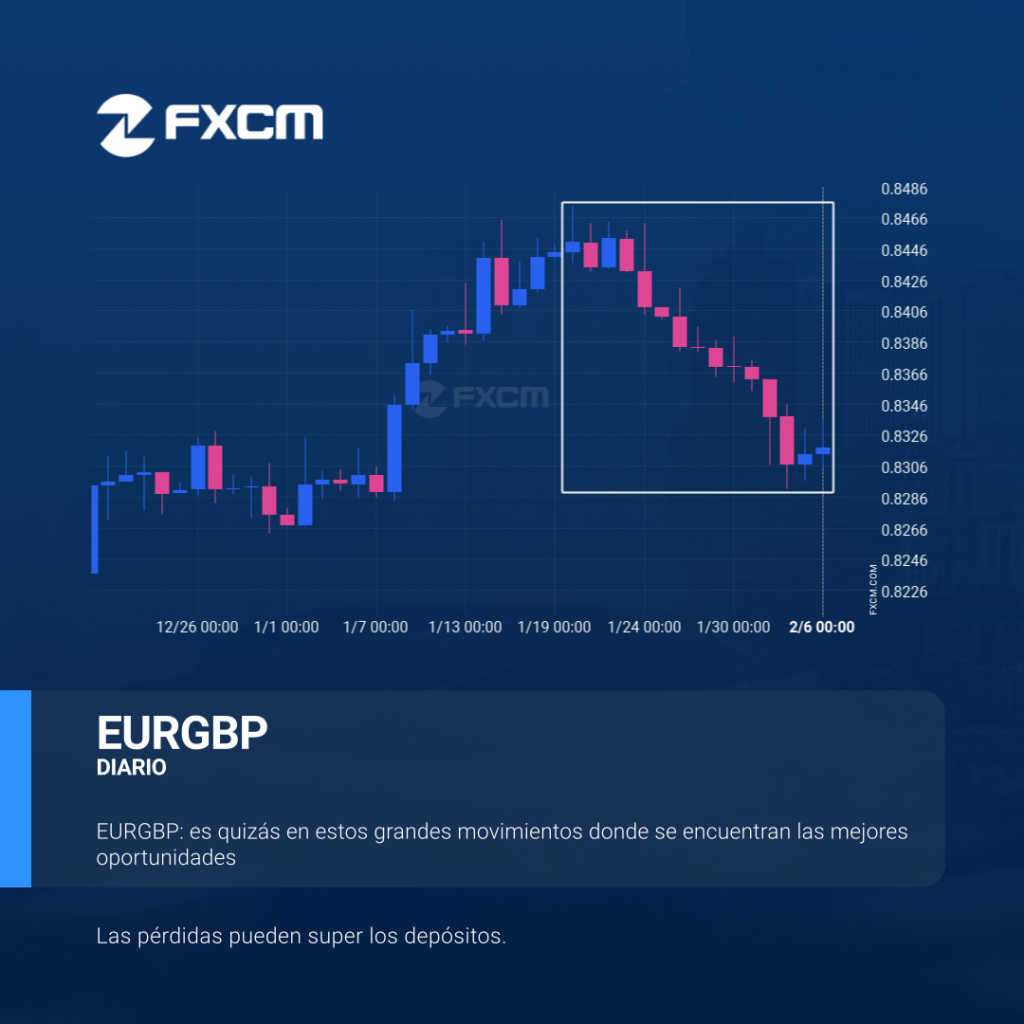
Para aquellos de ustedes que no creen en las tendencias, esta puede ser una oportunidad para aprovechar un excepcional movimiento de un 1,57% en EURGBP. Este movimiento ha ocurrido durante los últimos 18 días. Por otro lado, para aquellos que siguen las tendencias, deben considerar aprovecharse de esta. El rendimiento pasado no es indicativo de […]
A potential bearish movement on HKG33
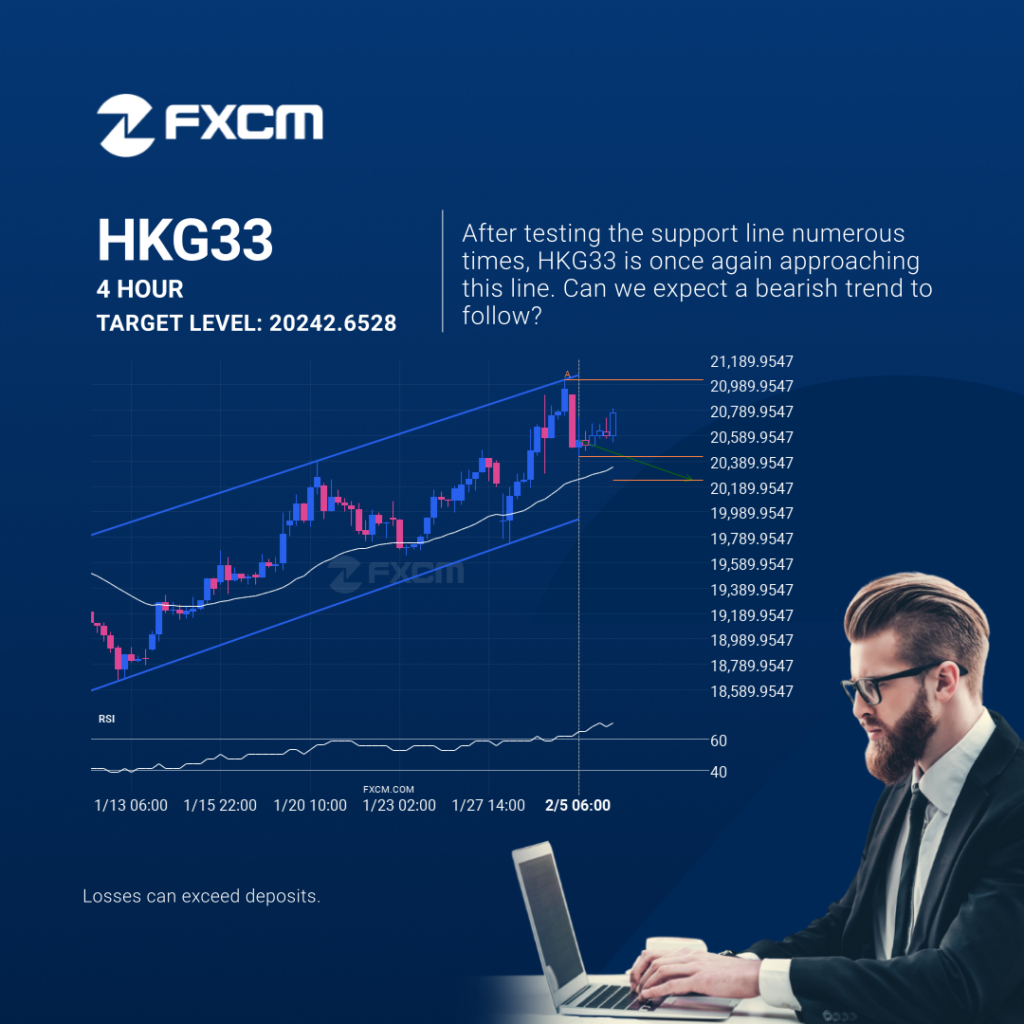
HKG33 is approaching the support line of a Channel Up. It has touched this line numerous times in the last 38 days. If it tests this line again, it should do so in the next 3 days. Past performance is not an indicator of future results. Losses can exceed deposits.
EURGBP was on its way down

For those of you that don’t believe in trends, this may be an opportunity to take advantage of an exceptional 1.57% move on EURGBP. The movement has happened over the last 18 days. For those trend followers among you, you may think about riding this possible trend. Past performance is not an indicator of future […]
Important price line breached by NZDUSD
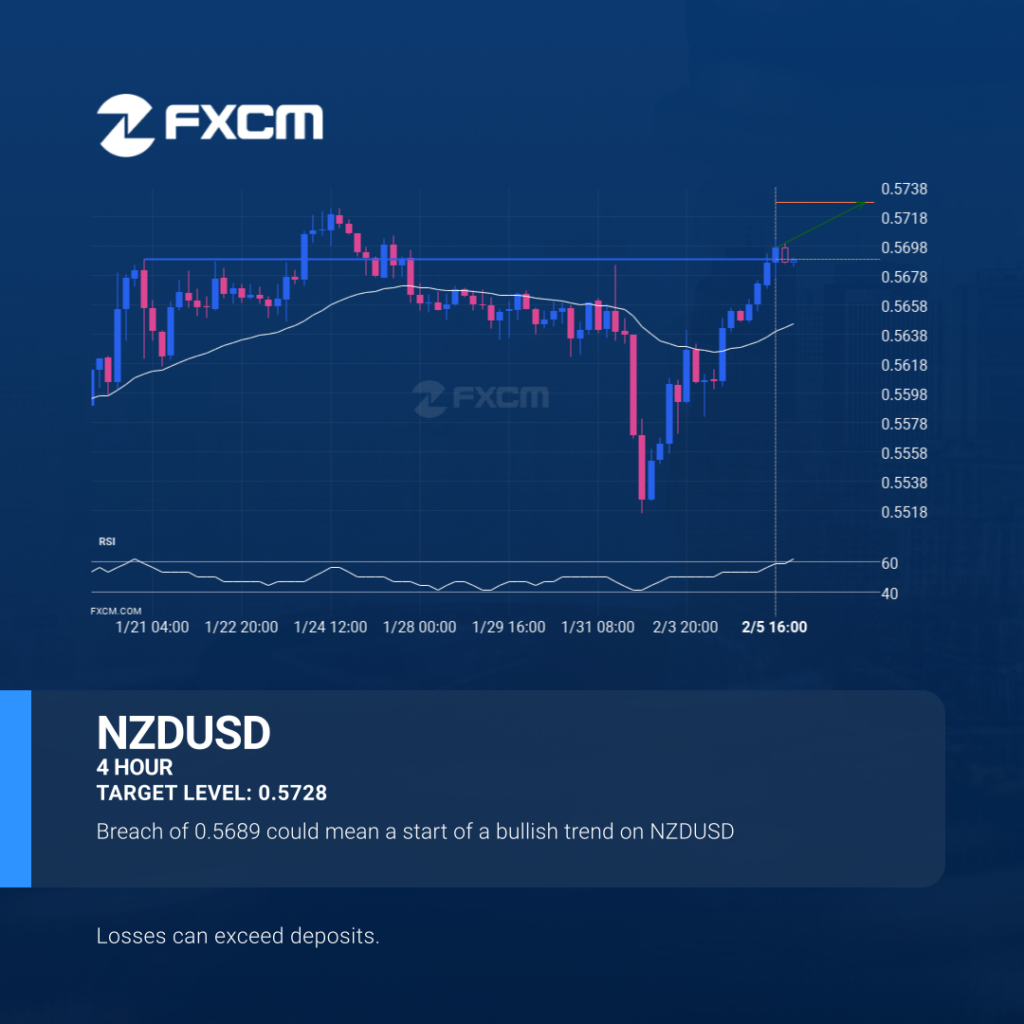
A strong resistance level has been breached at 0.5689 on the 4 hour NZDUSD chart. Technical Analysis theory forecasts a movement to 0.5728 in the next 3 days. Past performance is not an indicator of future results. Losses can exceed deposits.
Importante línea de precio atravesada por el NZDUSD
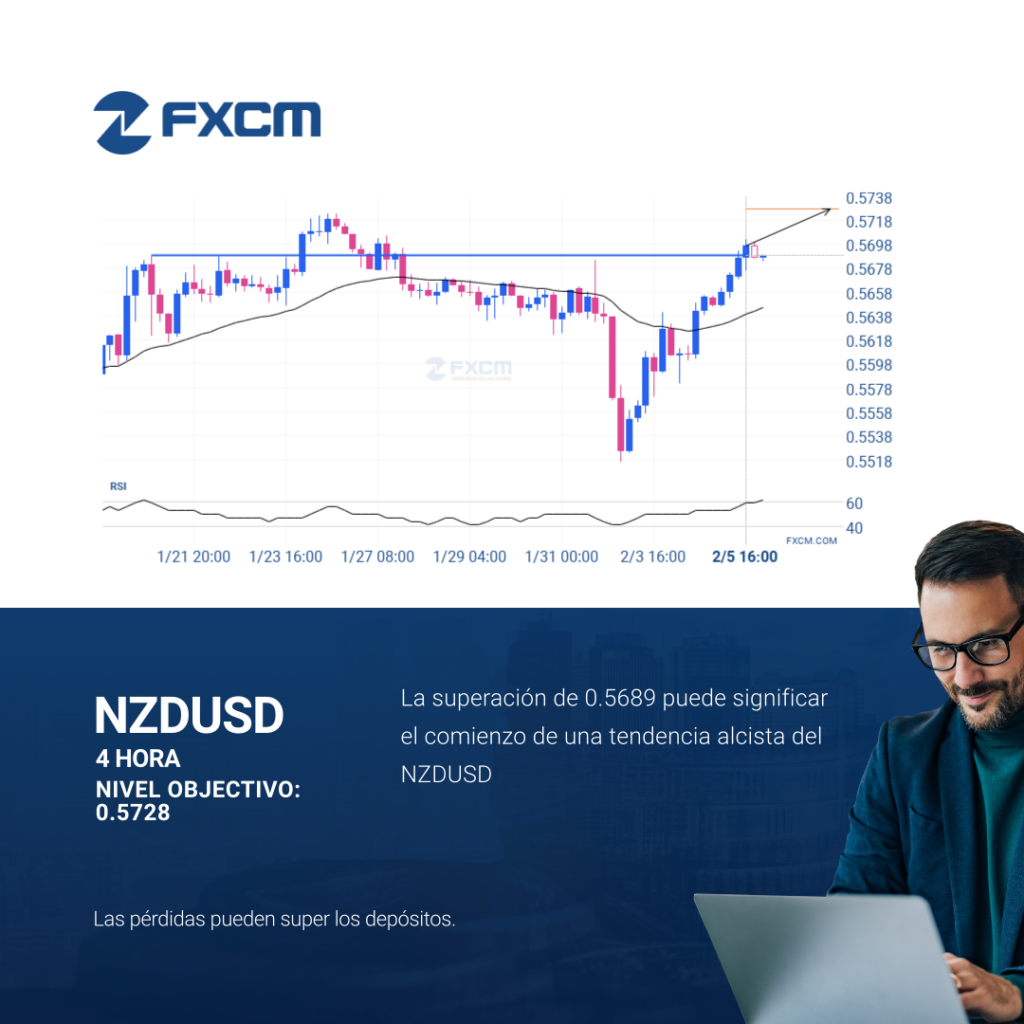
Se ha atravesado un fuerte nivel de resistencia en 0.5689 en el gráfico de 4 Hora de NZDUSD. La teoría del análisis técnico pronostica un movimiento a 0.5728 en el próximo período de 3 días. El rendimiento pasado no es indicativo de resultados futuros. Las pérdidas pueden exceder los fondos depositados.
Important price line breached by NZDUSD

A strong resistance level has been breached at 0.5689 on the 4 hour NZDUSD chart. Technical Analysis theory forecasts a movement to 0.5728 in the next 3 days. Past performance is not an indicator of future results. Trading leveraged products carries significant risk. Please refer to PDS and TMD on our website. AFSL#309763
Important price line breached by NZDUSD
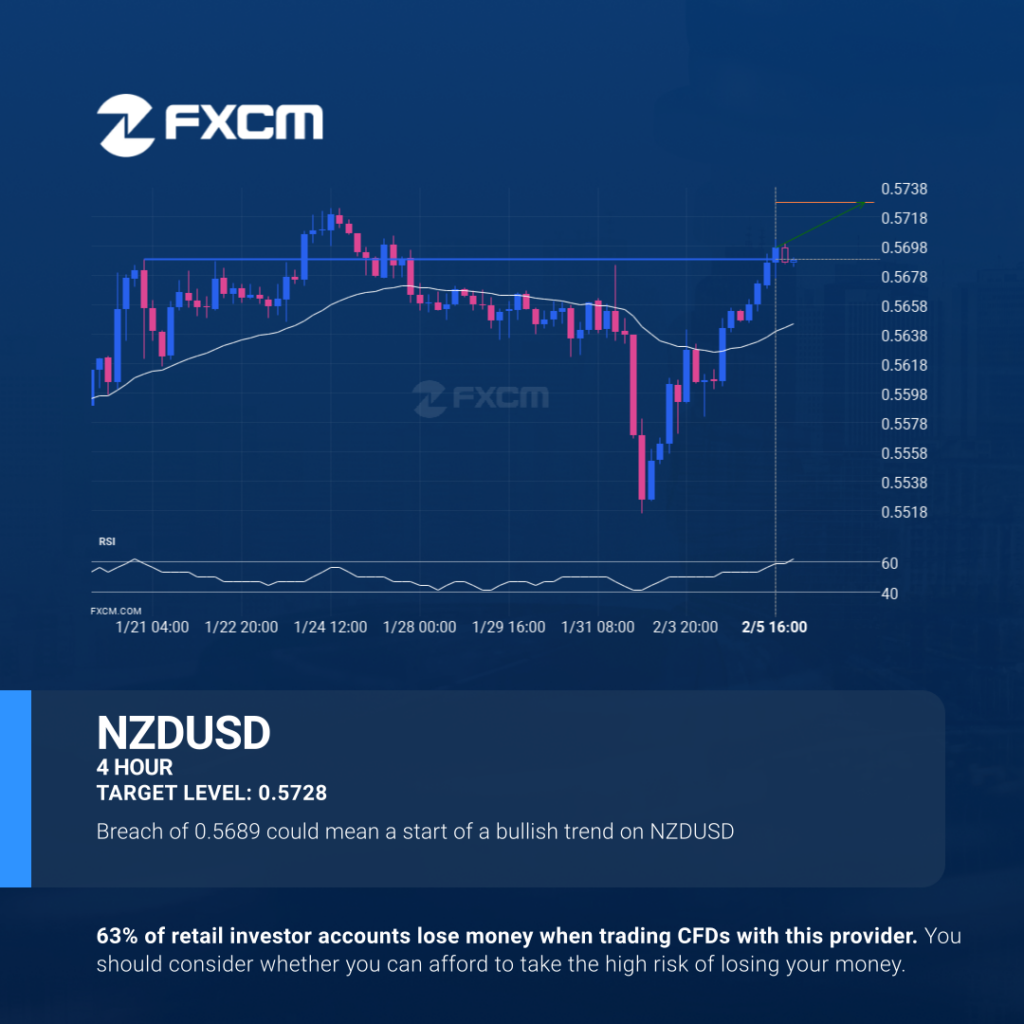
A strong resistance level has been breached at 0.5689 on the 4 hour NZDUSD chart. Technical Analysis theory forecasts a movement to 0.5728 in the next 3 days. Past performance is not an indicator of future results. 64% of retail investor accounts lose money when trading CFDs with this provider. You should consider whether you […]