Análisis Técnico Forex
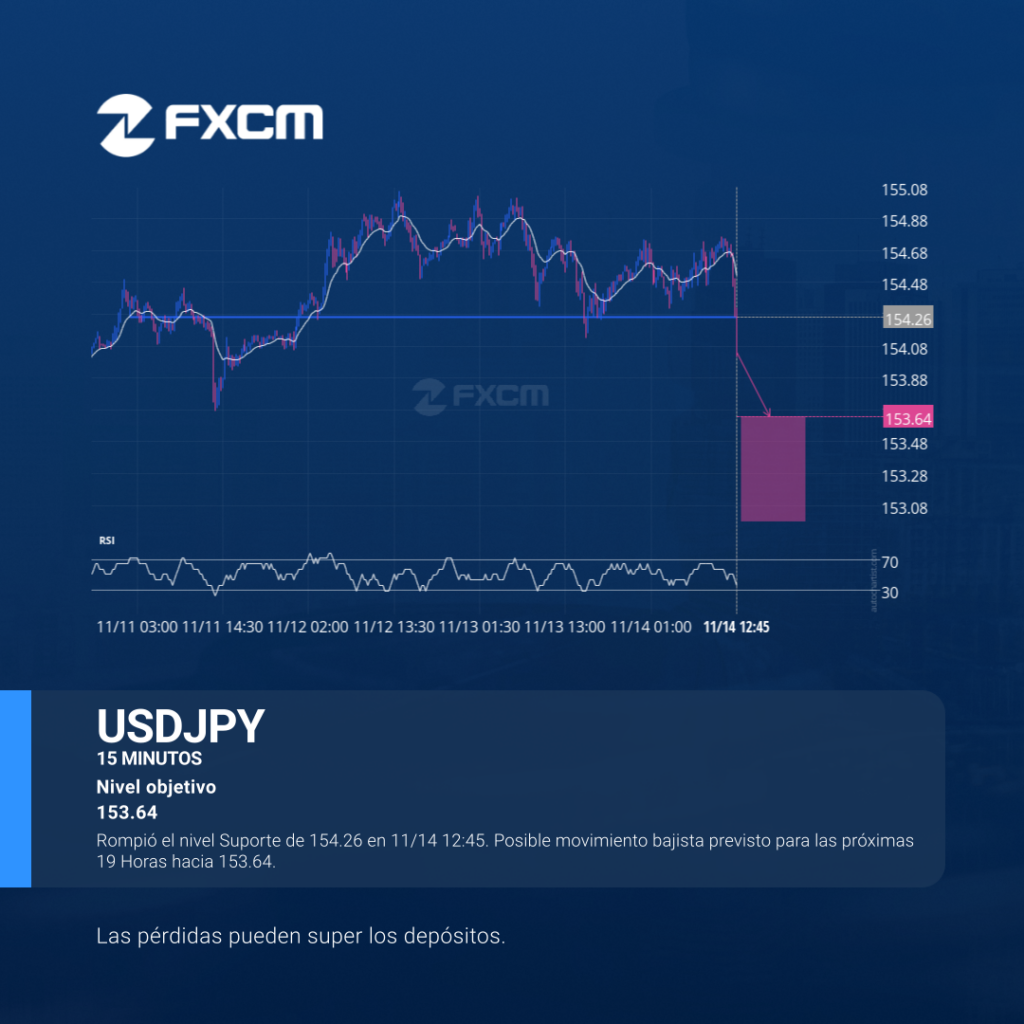
Rompió el nivel Suporte de 154.26 en 11/14 12:45. Posible movimiento bajista previsto para las próximas 19 Horas hacia 153.64. El rendimiento pasado no es indicativo de resultados futuros. Las pérdidas pueden exceder los fondos depositados.
Análisis Técnico Cripto
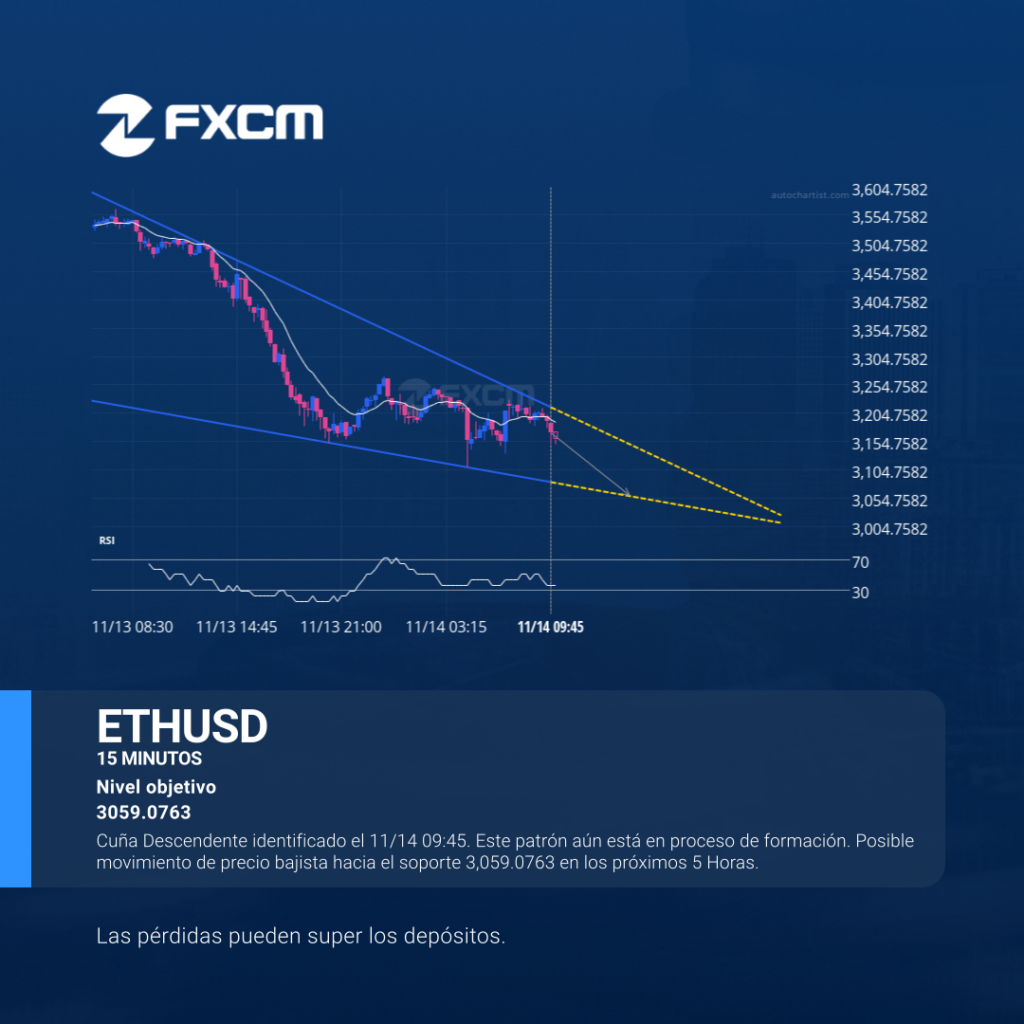
Cuña Descendente identificado el 11/14 09:45. Este patrón aún está en proceso de formación. Posible movimiento de precio bajista hacia el soporte 3,059.0763 en los próximos 5 Horas. El rendimiento pasado no es indicativo de resultados futuros. Las pérdidas pueden exceder los fondos depositados.
Technical Analysis Indices
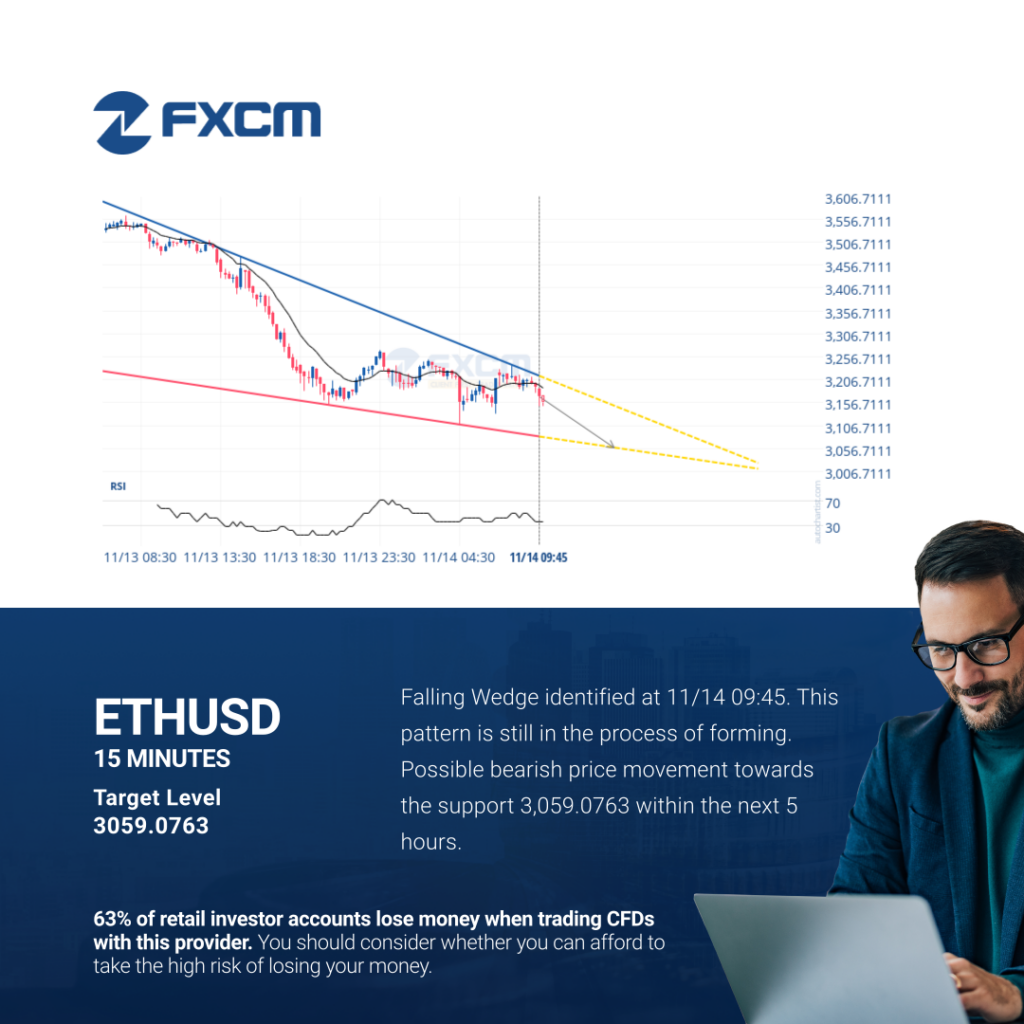
Falling Wedge identified at 11/14 09:45. This pattern is still in the process of forming. Possible bearish price movement towards the support 3,059.0763 within the next 5 hours. Past performance is not an indicator of future results. Losses can exceed deposits.
Índices de Análisis Técnico
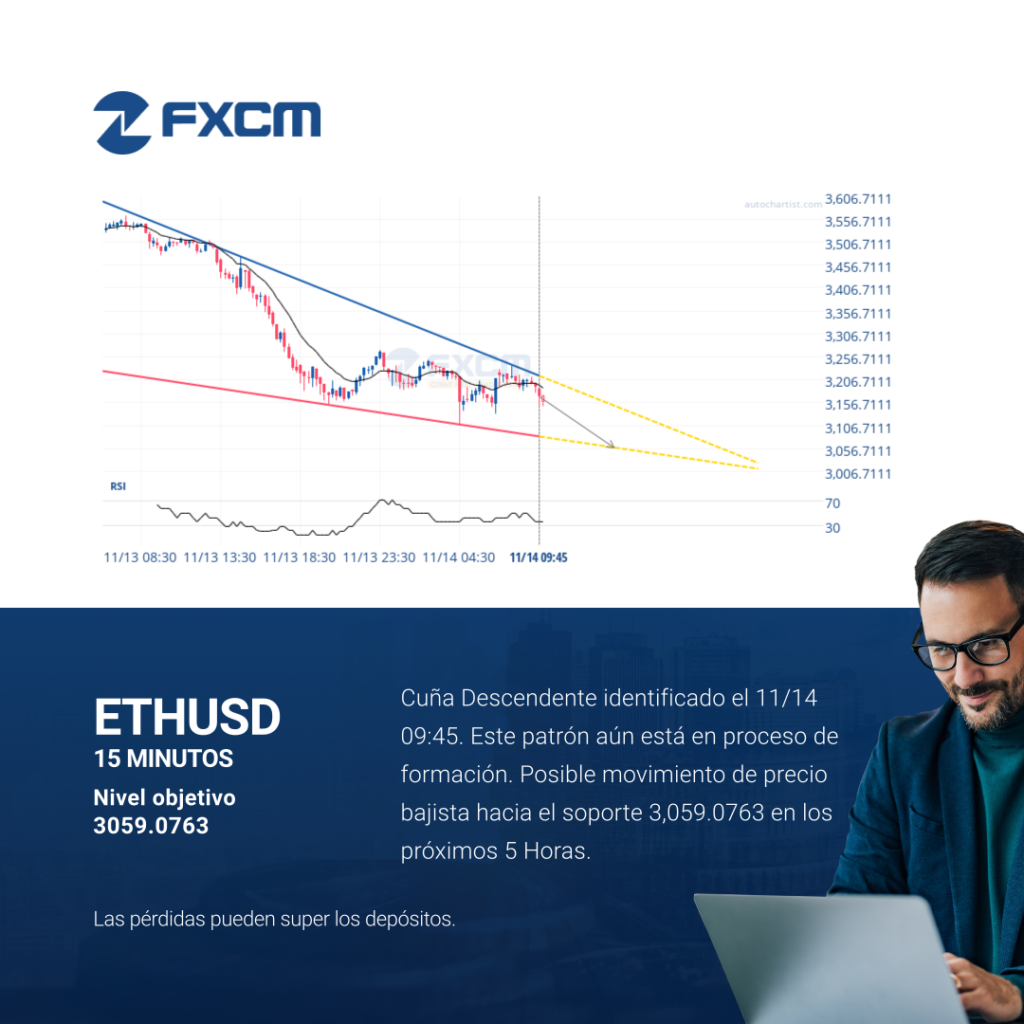
Cuña Descendente identificado el 11/14 09:45. Este patrón aún está en proceso de formación. Posible movimiento de precio bajista hacia el soporte 3,059.0763 en los próximos 5 Horas. El rendimiento pasado no es indicativo de resultados futuros. Las pérdidas pueden exceder los fondos depositados.
Análisis Técnico Cripto
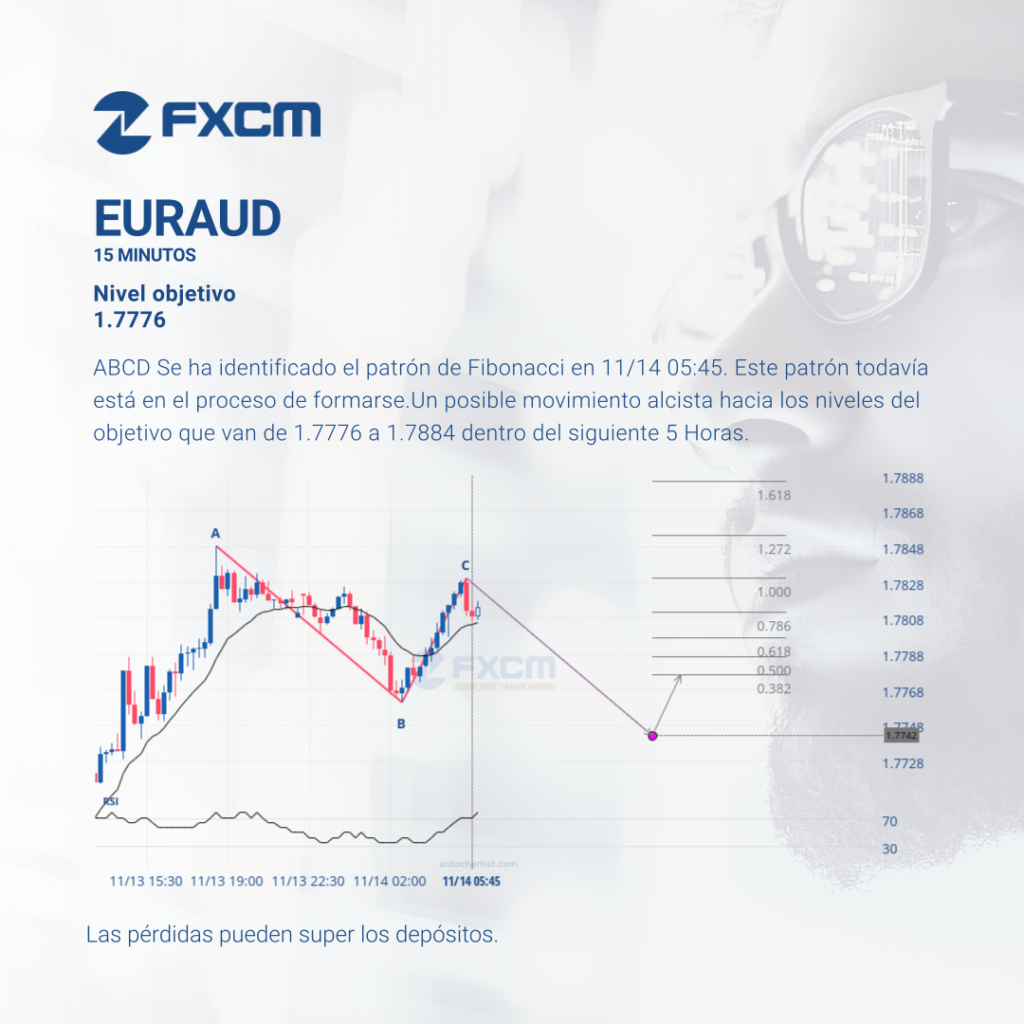
ABCD Se ha identificado el patrón de Fibonacci en 11/14 05:45. Este patrón todavía está en el proceso de formarse.Un posible movimiento alcista hacia los niveles del objetivo que van de 1.7776 a 1.7884 dentro del siguiente 5 Horas. El rendimiento pasado no es indicativo de resultados futuros. Las pérdidas pueden exceder los fondos depositados.
Índices de Análisis Técnico
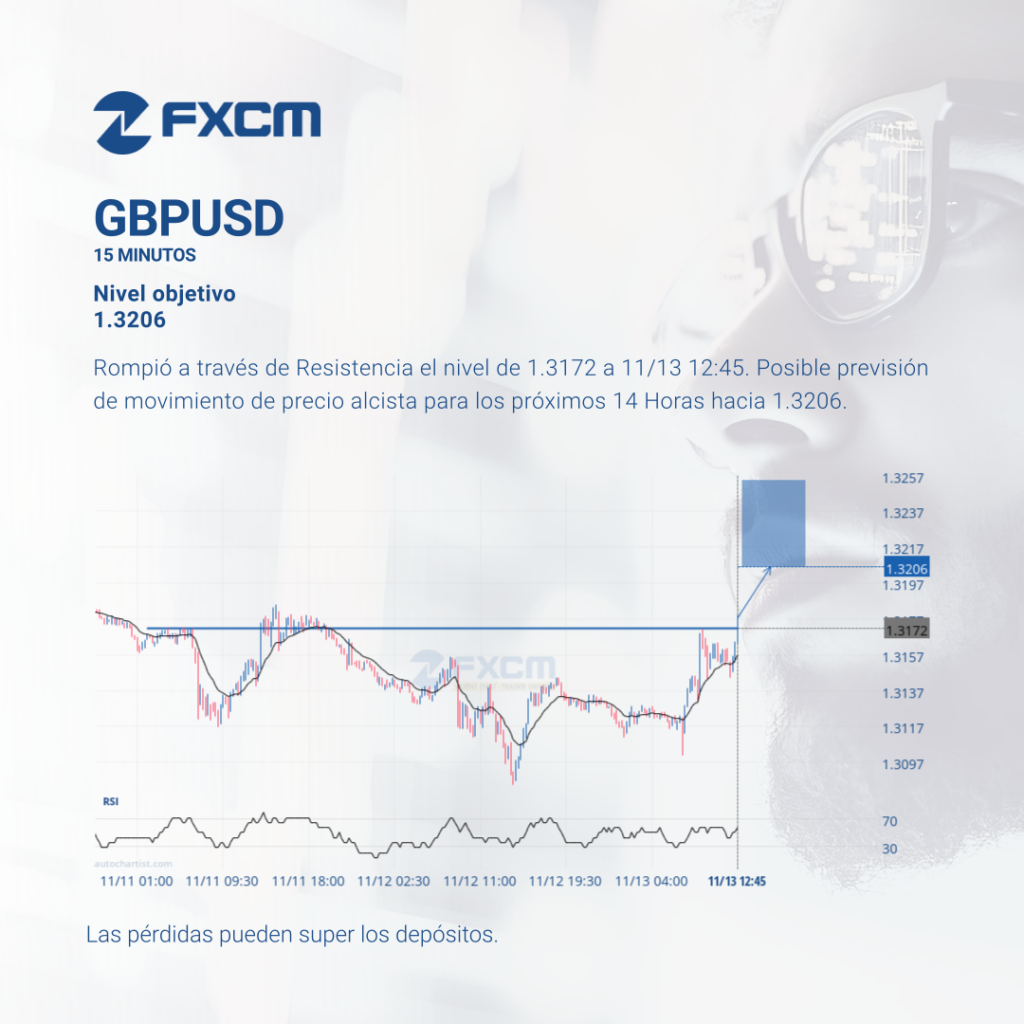
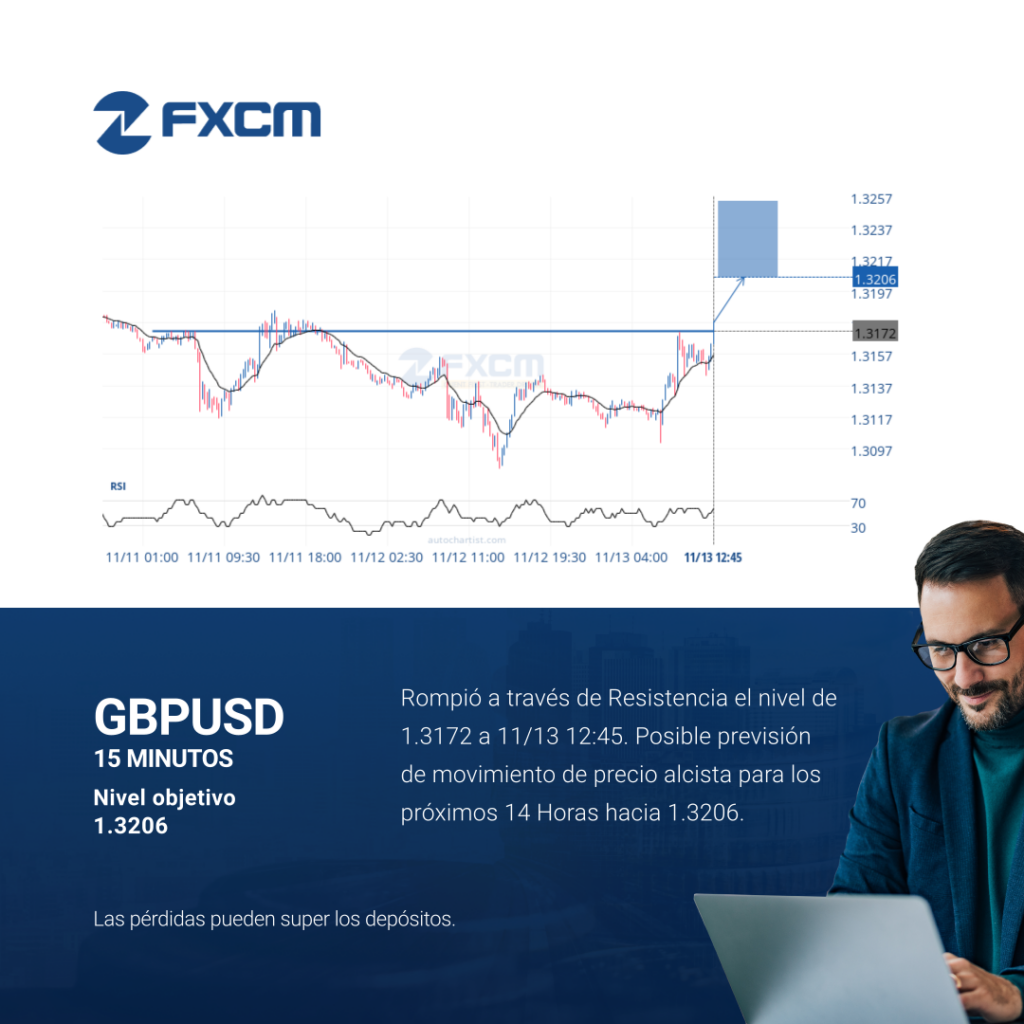
Rompió a través de Resistencia el nivel de 1.3172 a 11/13 12:45. Posible previsión de movimiento de precio alcista para los próximos 14 Horas hacia 1.3206. El rendimiento pasado no es indicativo de resultados futuros. Las pérdidas pueden exceder los fondos depositados.
Análisis Técnico Cripto
Rompió a través de Resistencia el nivel de 1.3172 a 11/13 12:45. Posible previsión de movimiento de precio alcista para los próximos 14 Horas hacia 1.3206. El rendimiento pasado no es indicativo de resultados futuros. Las pérdidas pueden exceder los fondos depositados.
Análisis Técnico Cripto
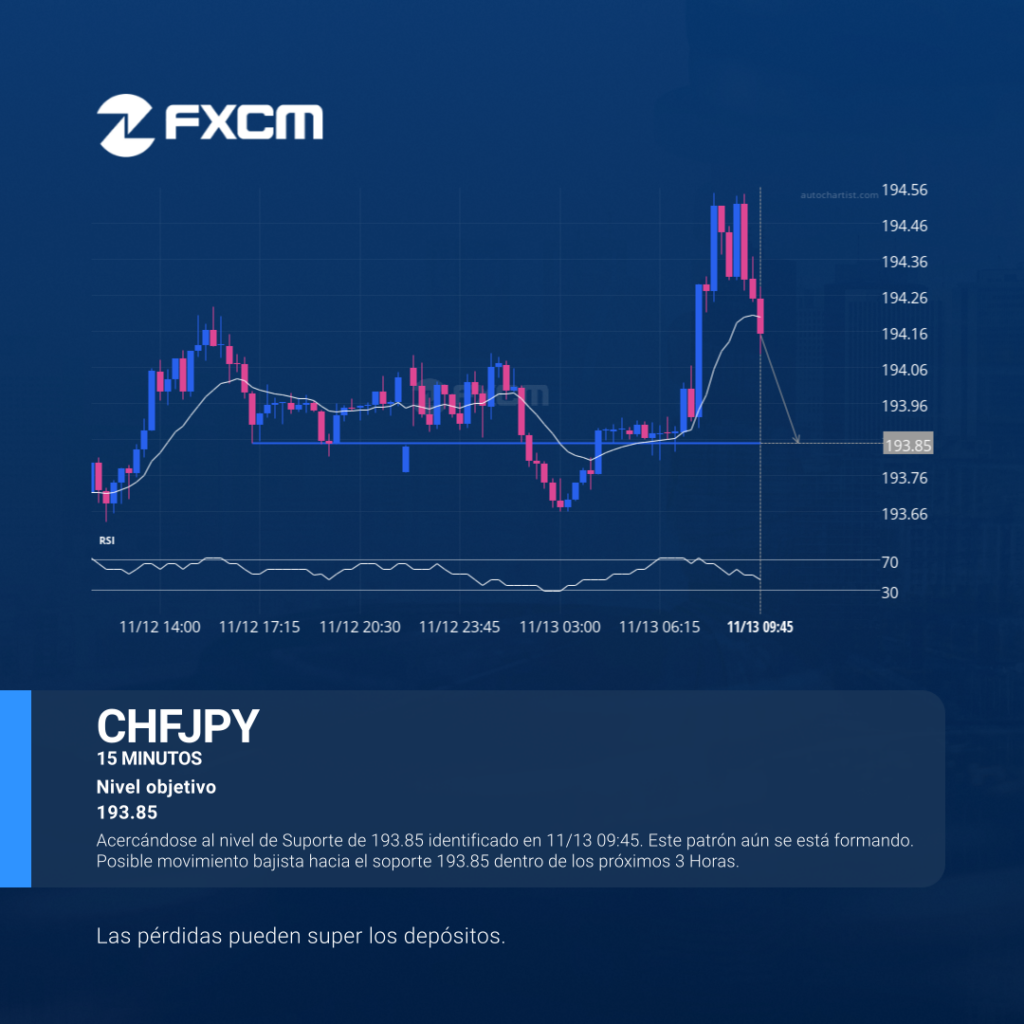
Acercándose al nivel de Suporte de 193.85 identificado en 11/13 09:45. Este patrón aún se está formando. Posible movimiento bajista hacia el soporte 193.85 dentro de los próximos 3 Horas. El rendimiento pasado no es indicativo de resultados futuros. Las pérdidas pueden exceder los fondos depositados.
Technical Analysis Forex
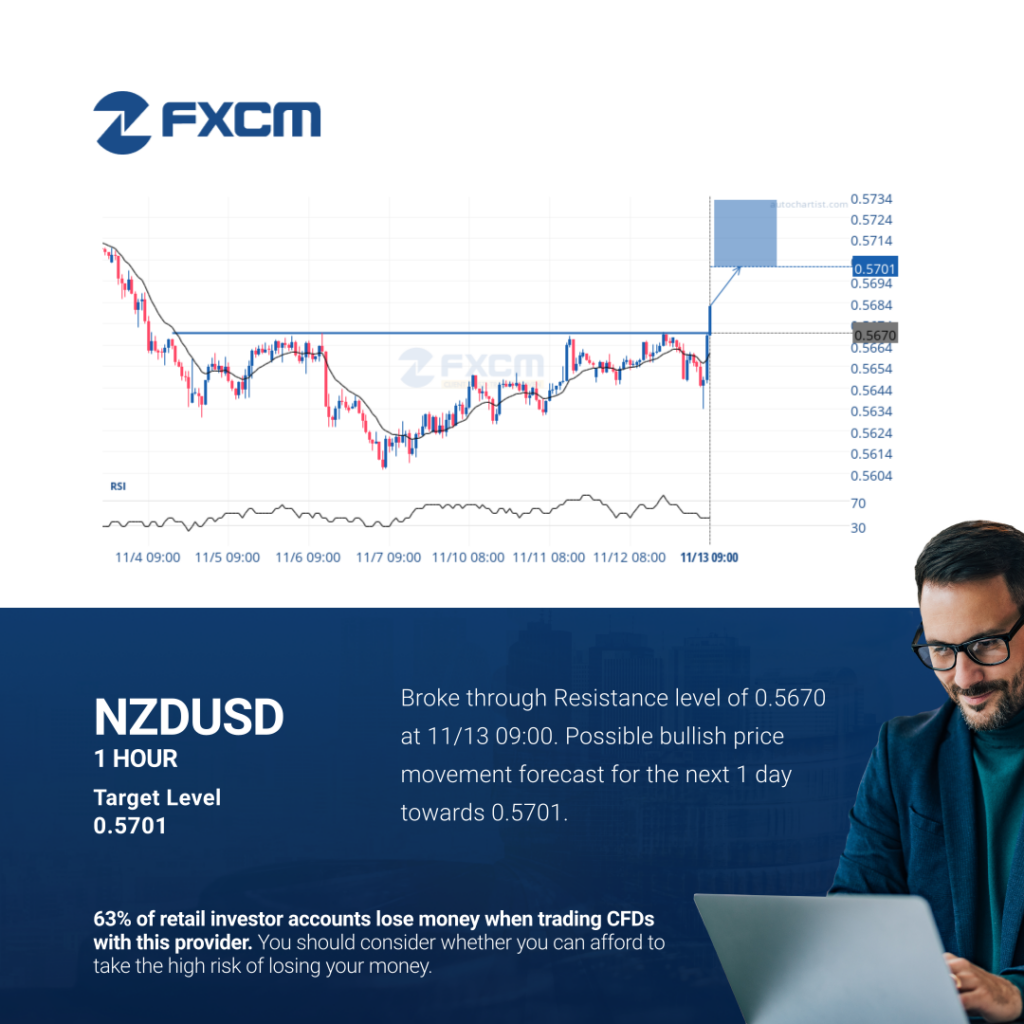
Broke through Resistance level of 0.5670 at 11/13 09:00. Possible bullish price movement forecast for the next 1 day towards 0.5701. Past performance is not an indicator of future results. Losses can exceed deposits.
Índices de Análisis Técnico
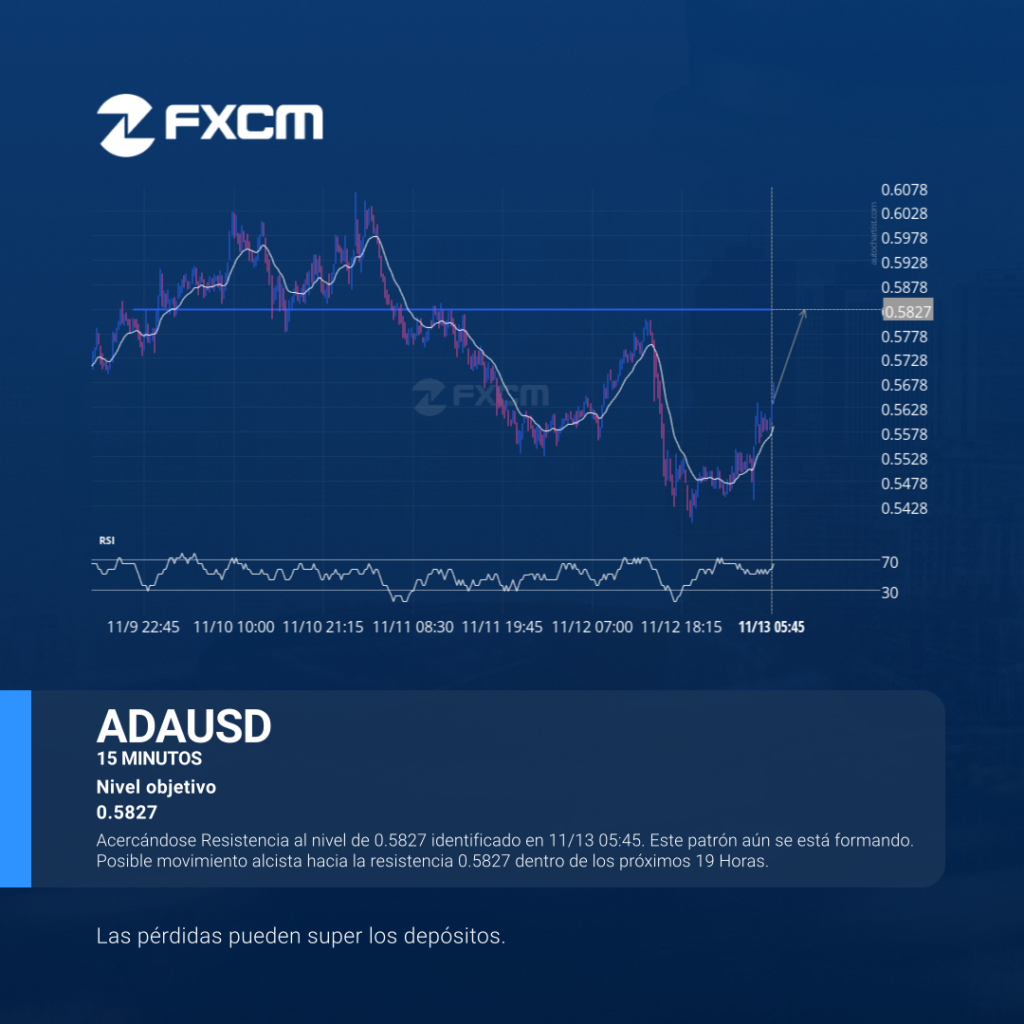
Acercándose Resistencia al nivel de 0.5827 identificado en 11/13 05:45. Este patrón aún se está formando. Posible movimiento alcista hacia la resistencia 0.5827 dentro de los próximos 19 Horas. El rendimiento pasado no es indicativo de resultados futuros. Las pérdidas pueden exceder los fondos depositados.