Análisis Técnico Cripto
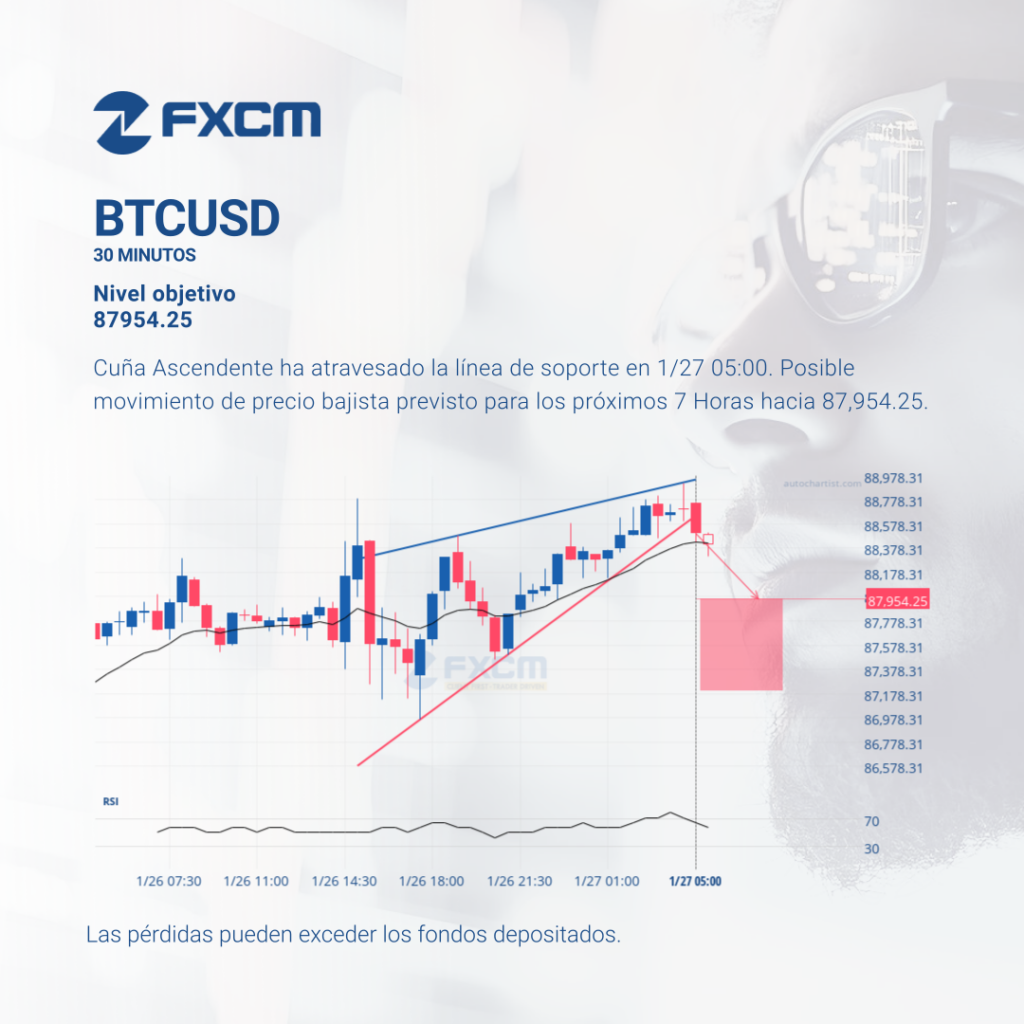
Cuña Ascendente ha atravesado la línea de soporte en 1/27 05:00. Posible movimiento de precio bajista previsto para los próximos 7 Horas hacia 87,954.25. El rendimiento pasado no es indicativo de resultados futuros. Las pérdidas pueden exceder los depósitos.
Technical Analysis Indices
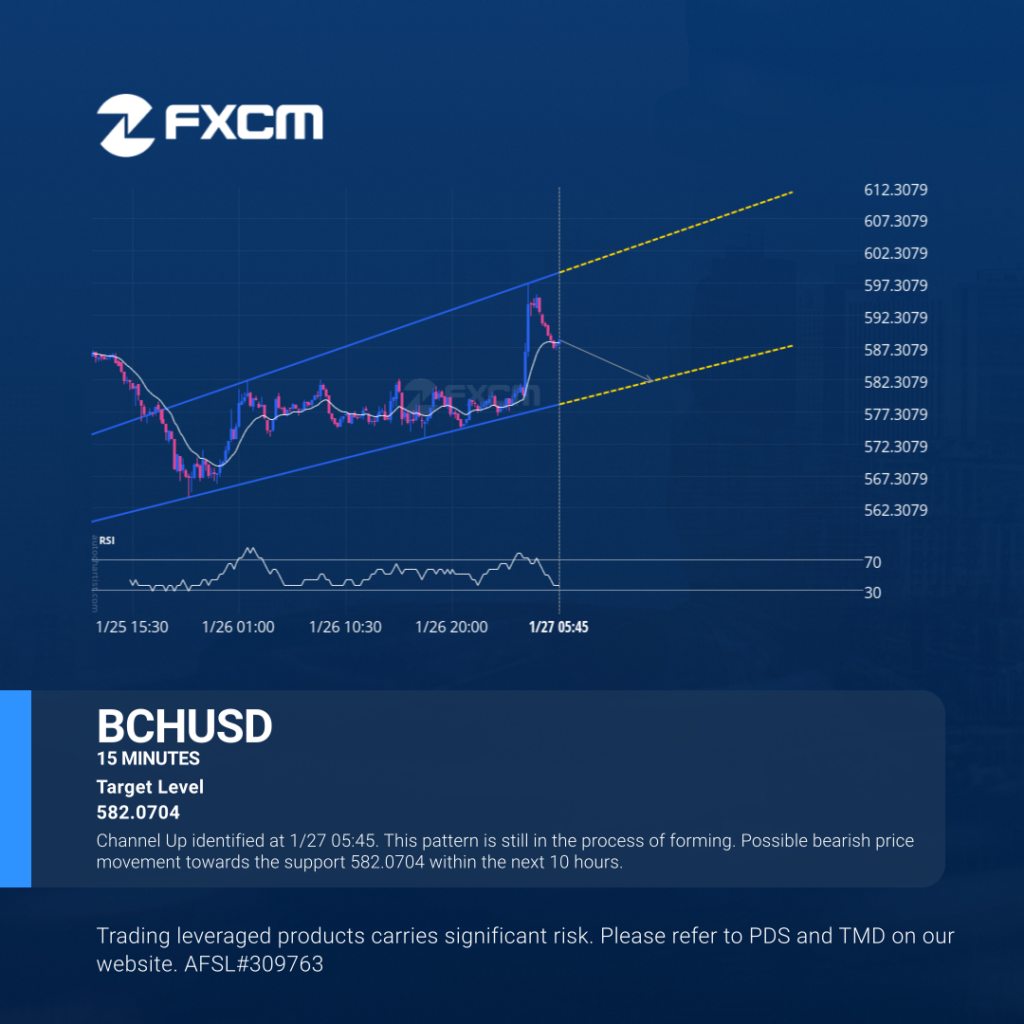
Channel Up identified at 1/27 05:45. This pattern is still in the process of forming. Possible bearish price movement towards the support 582.0704 within the next 10 hours. Past performance is not an indicator of future results. Trading leveraged products carries significant risk. Please refer to PDS and TMD on our website. AFSL#309763
Índices de Análisis Técnico
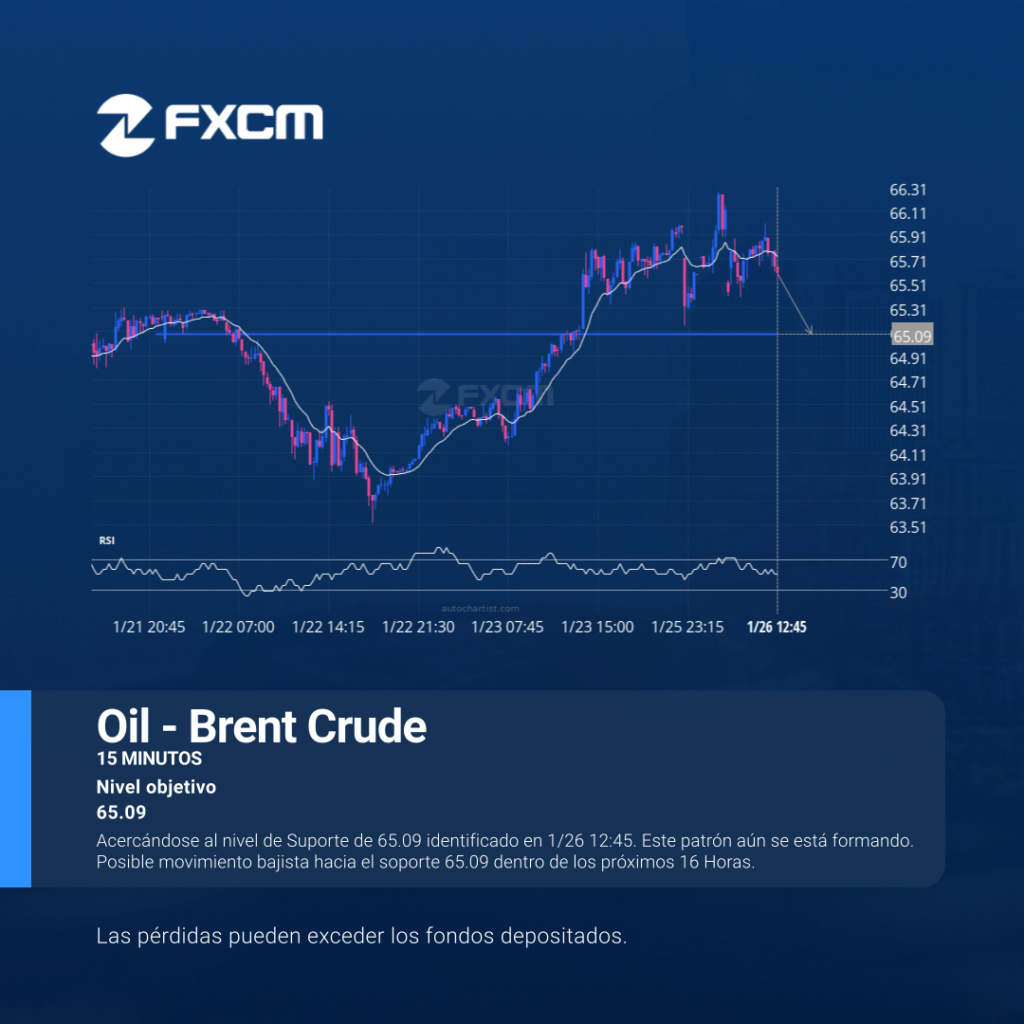
Acercándose al nivel de Suporte de 65.09 identificado en 1/26 12:45. Este patrón aún se está formando. Posible movimiento bajista hacia el soporte 65.09 dentro de los próximos 16 Horas. Las pérdidas pueden exceder los depósitos.
Análisis Técnico Cripto
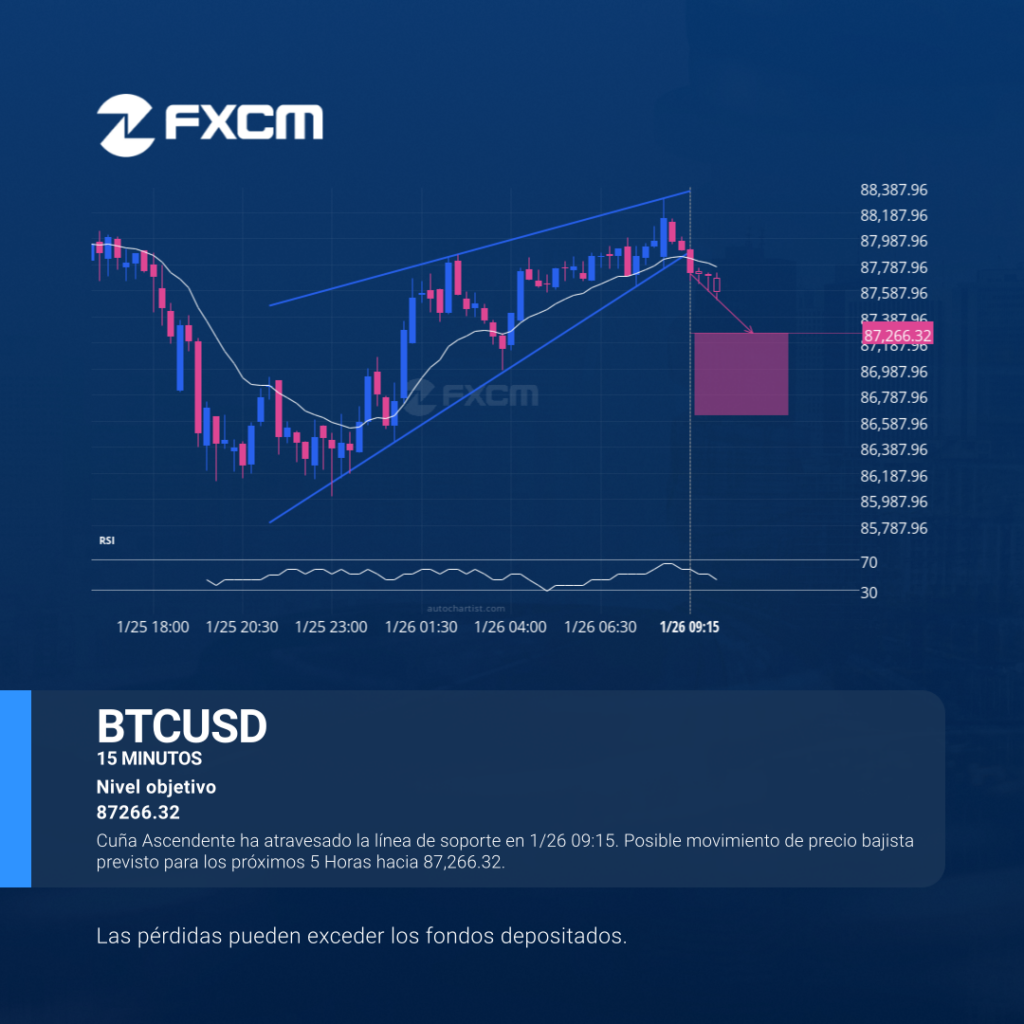
Cuña Ascendente ha atravesado la línea de soporte en 1/26 09:15. Posible movimiento de precio bajista previsto para los próximos 5 Horas hacia 87,266.32. El rendimiento pasado no es indicativo de resultados futuros. Las pérdidas pueden exceder los depósitos.
Índices de Análisis Técnico
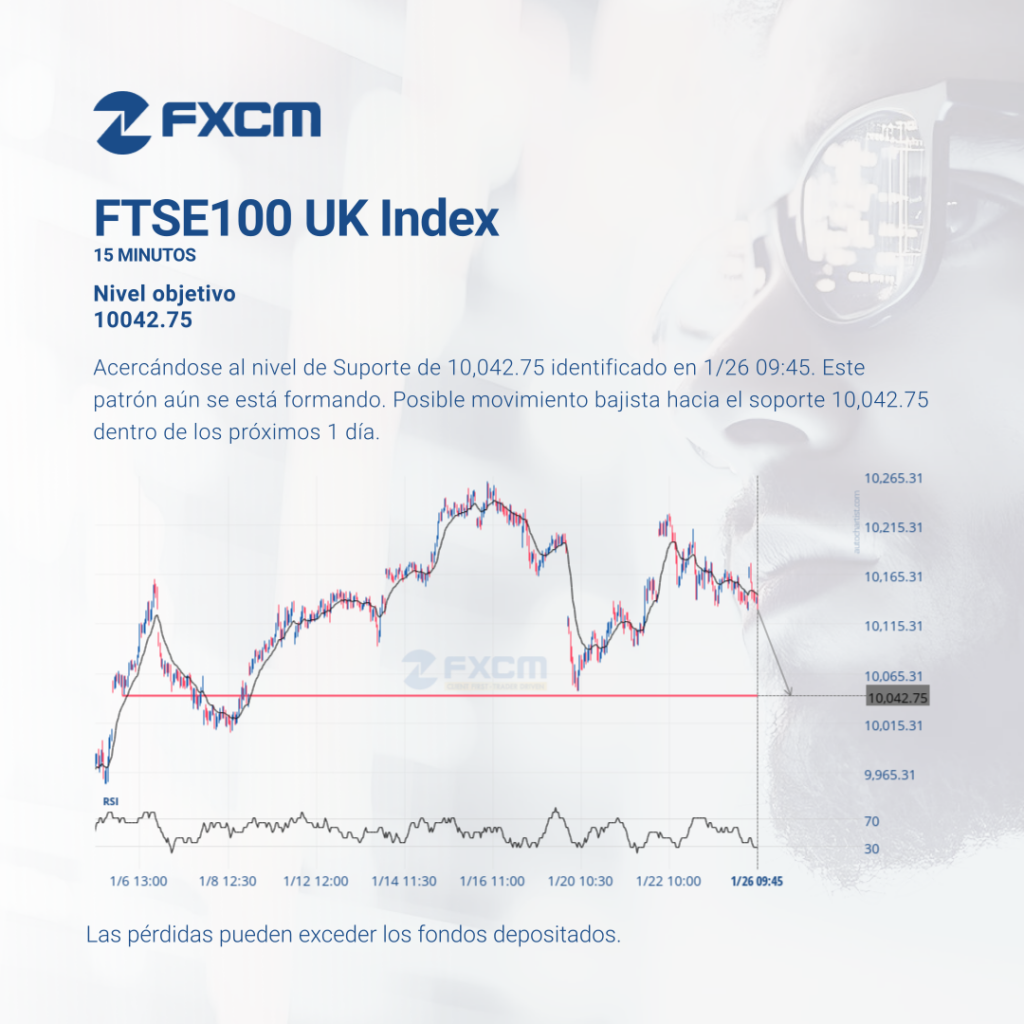
Acercándose al nivel de Suporte de 10,042.75 identificado en 1/26 09:45. Este patrón aún se está formando. Posible movimiento bajista hacia el soporte 10,042.75 dentro de los próximos 1 día. Las pérdidas pueden exceder los depósitos.
Análisis Técnico Cripto
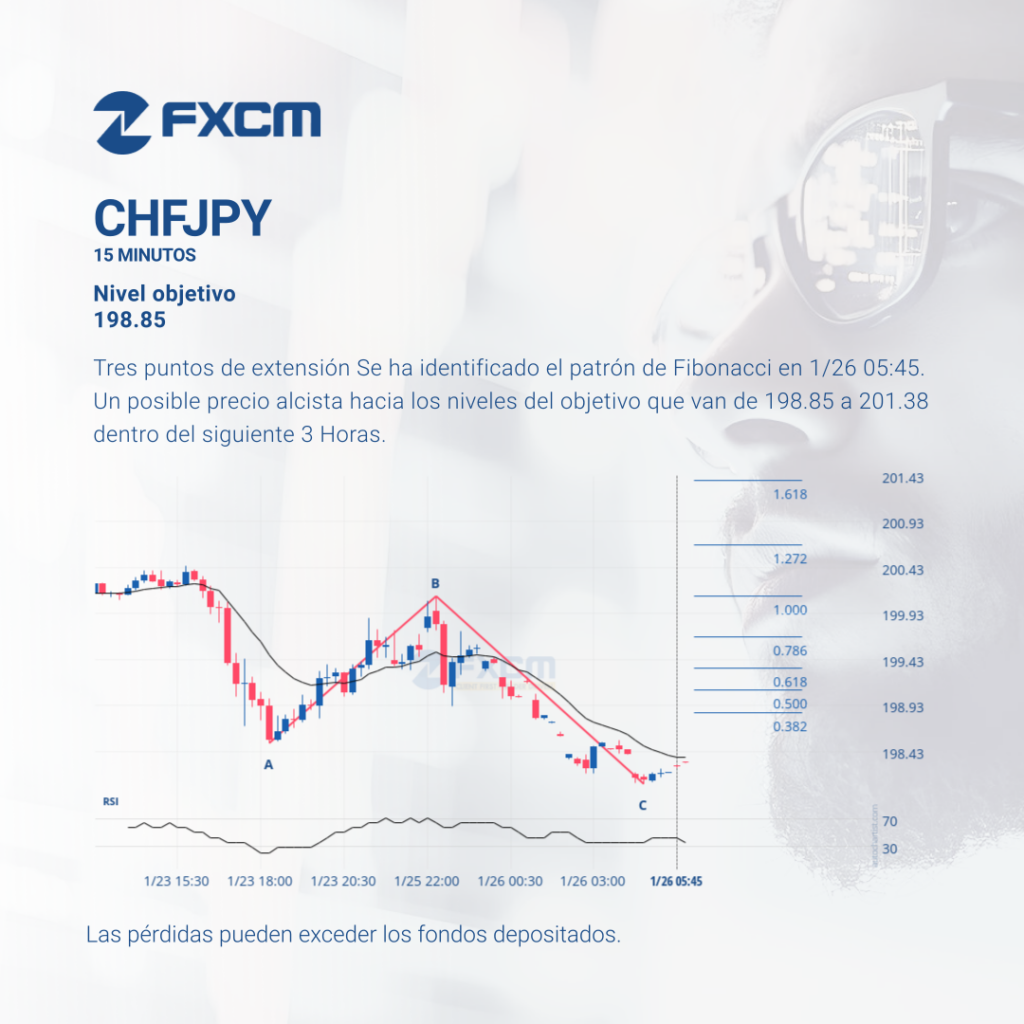
Tres puntos de extensión Se ha identificado el patrón de Fibonacci en 1/26 05:45. Un posible precio alcista hacia los niveles del objetivo que van de 198.85 a 201.38 dentro del siguiente 3 Horas. El rendimiento pasado no es indicativo de resultados futuros. Las pérdidas pueden exceder los depósitos.
Análisis Técnico Cripto
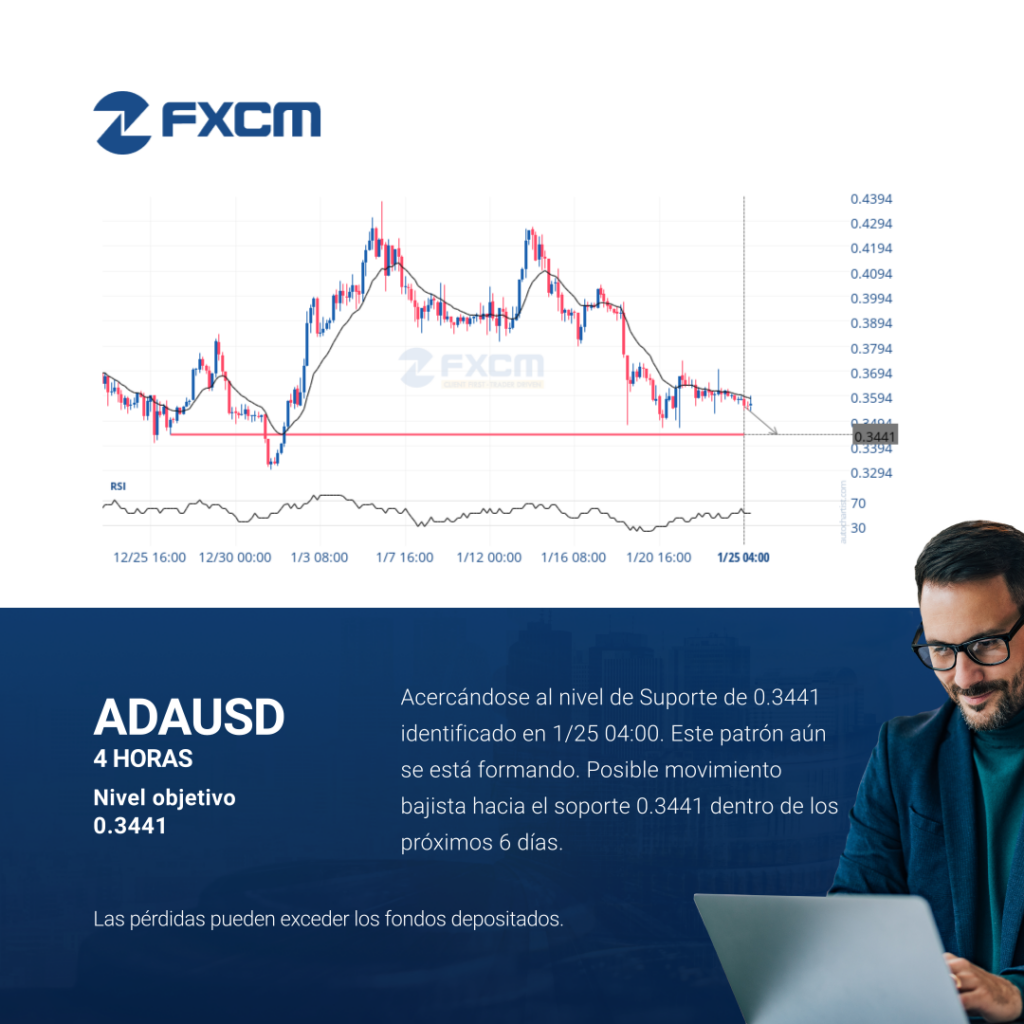
Acercándose al nivel de Suporte de 0.3441 identificado en 1/25 04:00. Este patrón aún se está formando. Posible movimiento bajista hacia el soporte 0.3441 dentro de los próximos 6 días. El rendimiento pasado no es indicativo de resultados futuros. Las pérdidas pueden exceder los depósitos.
Technical Analysis Indices
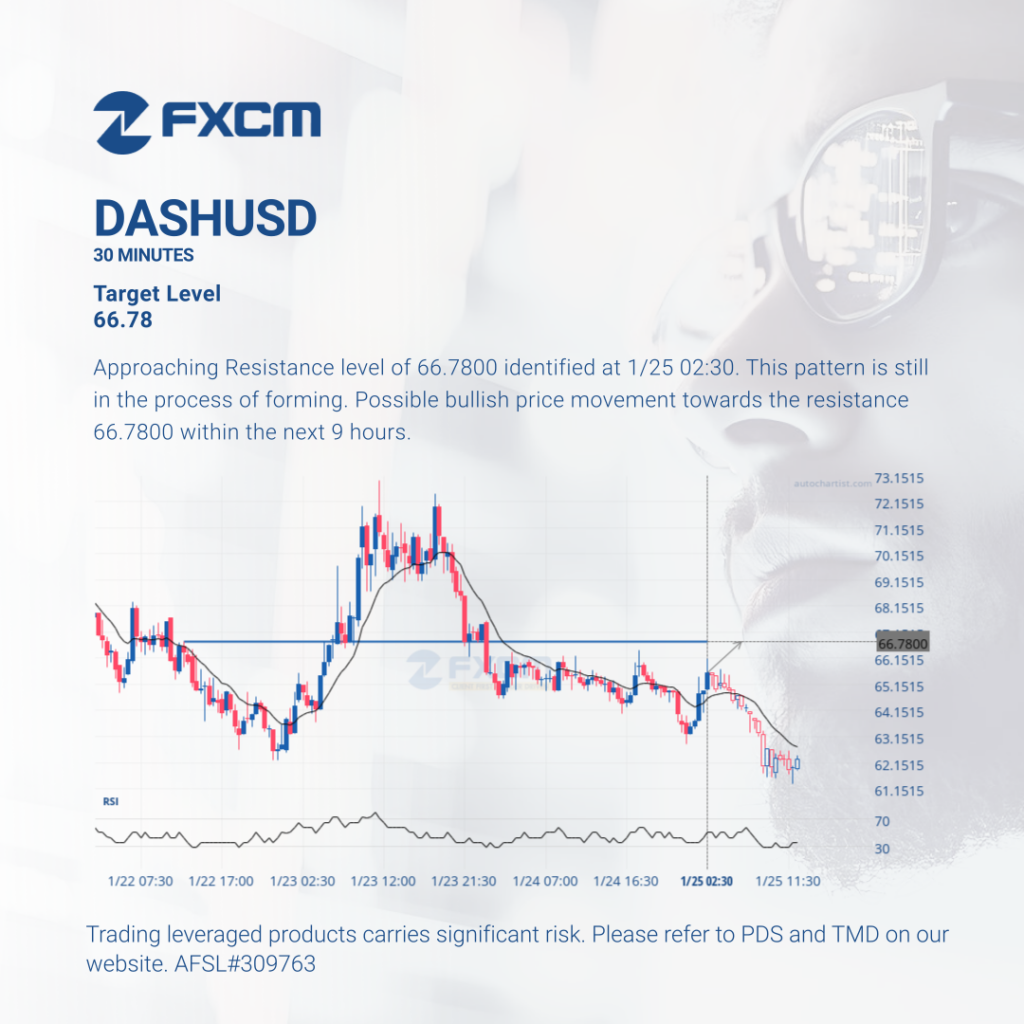
Approaching Resistance level of 66.7800 identified at 1/25 02:30. This pattern is still in the process of forming. Possible bullish price movement towards the resistance 66.7800 within the next 9 hours. Past performance is not an indicator of future results. Trading leveraged products carries significant risk. Please refer to PDS and TMD on our website. […]
Análisis Técnico Cripto
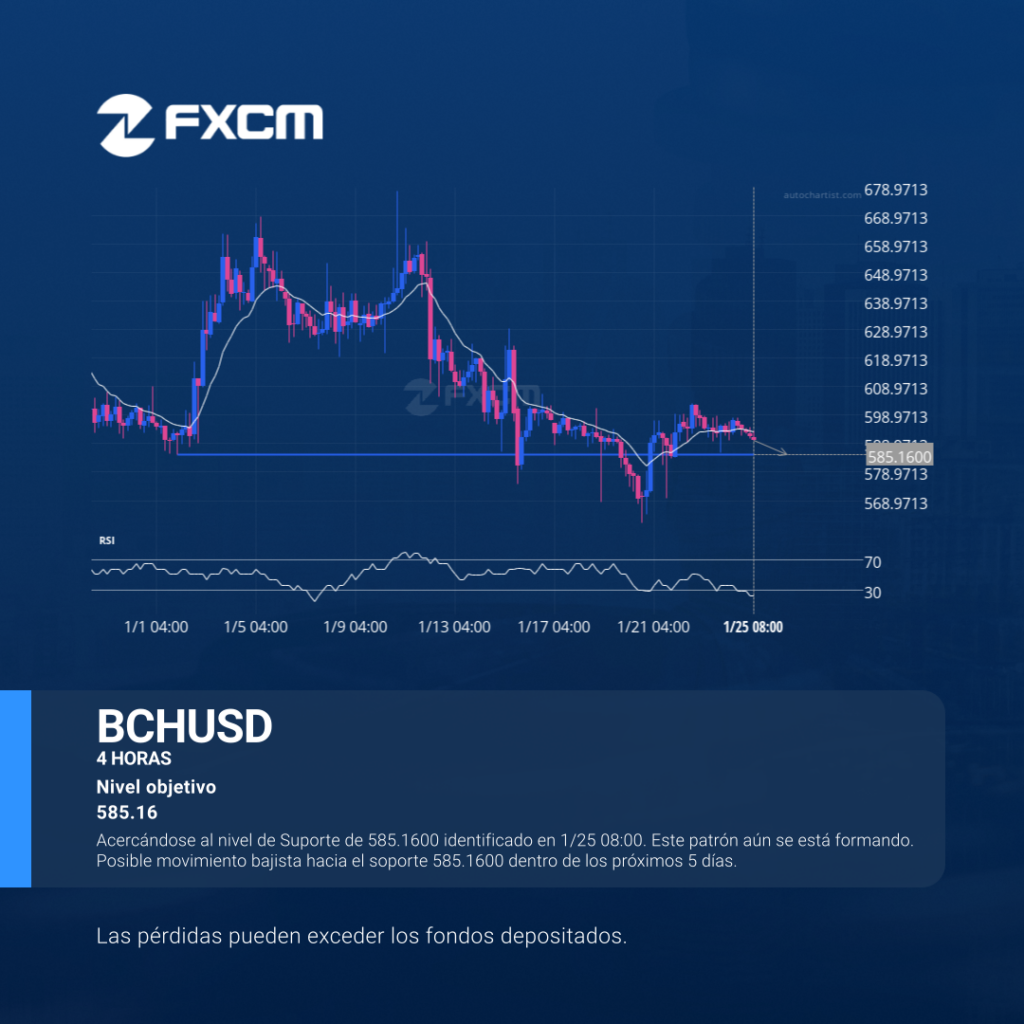
Acercándose al nivel de Suporte de 585.1600 identificado en 1/25 08:00. Este patrón aún se está formando. Posible movimiento bajista hacia el soporte 585.1600 dentro de los próximos 5 días. El rendimiento pasado no es indicativo de resultados futuros. Las pérdidas pueden exceder los depósitos.
Technical Analysis Indices
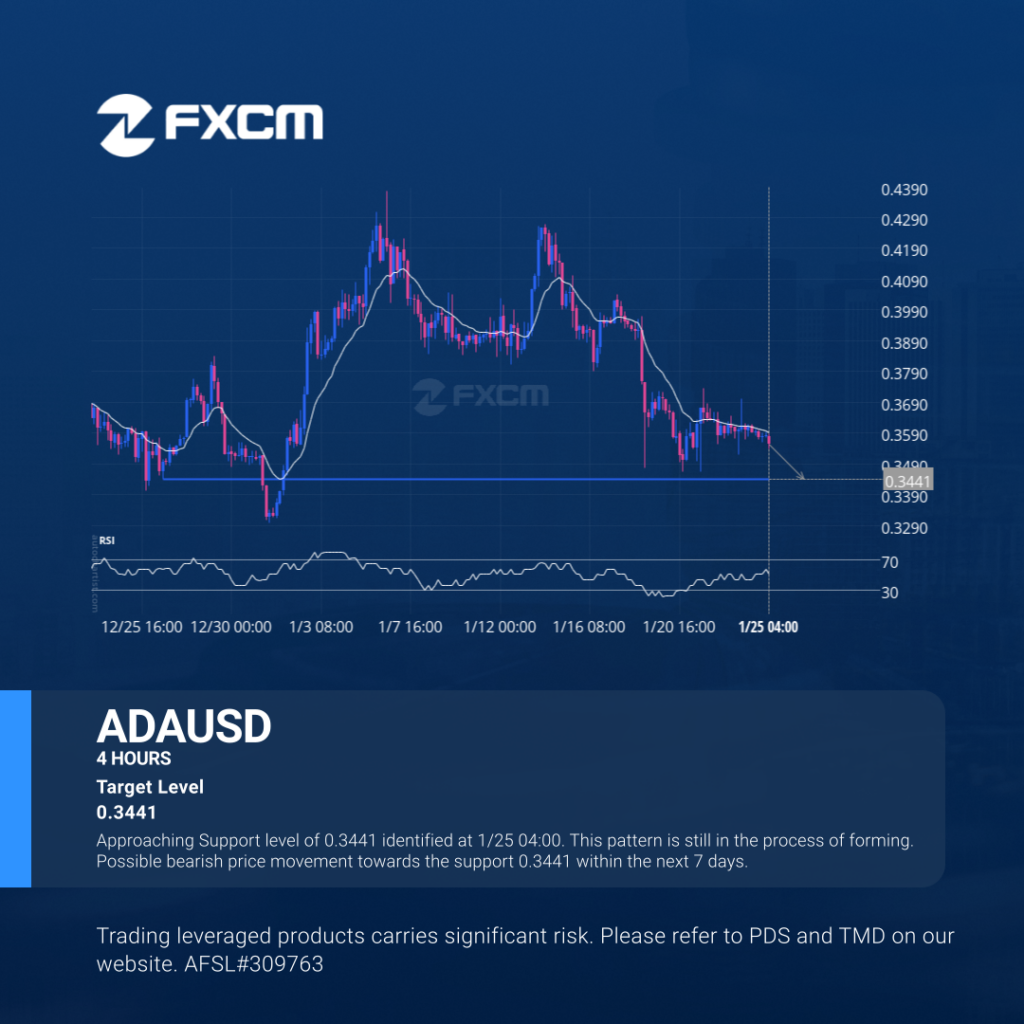
Approaching Support level of 0.3441 identified at 1/25 04:00. This pattern is still in the process of forming. Possible bearish price movement towards the support 0.3441 within the next 7 days. Past performance is not an indicator of future results. Trading leveraged products carries significant risk. Please refer to PDS and TMD on our website. […]