ESP35 – support line broken at 2025-10-10T15:00:00.000Z
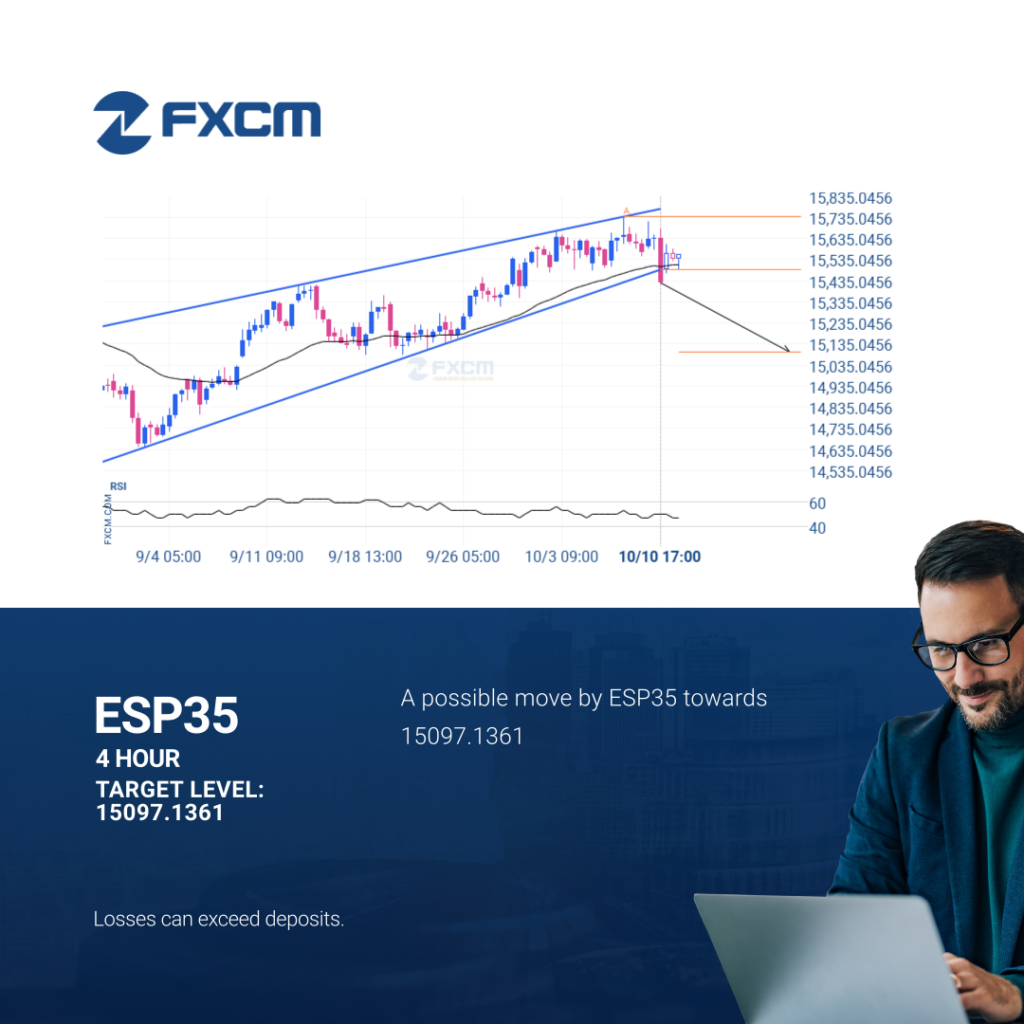
ESP35 has broken through a support line of a Rising Wedge and suggests a possible movement to 15097.1361 within the next 2 days. It has tested this line in the past, so one should probably wait for a confirmation of this breakout before taking action. If the breakout doesn’t confirm, we could see a retracement […]
¿Tendrá el EURUSD suficiente impulso como para irrumpir el soporte?

El EURUSD avanza hacia la línea de soporte de un Canal bajista, que ya ha probado varias veces en el pasado. Hemos visto un retroceso antes desde esta línea, así que en esta etapa no está claro si atravesará esta línea o se recuperará como lo ha hecho anteriormente. Si el EURUSD continúa con esta […]
Un posible impulso final en el BTCUSD

Se identificó un fuerte nivel de soporte en 111208.2891 en el gráfico de 30 Minutos de BTCUSD. Es probable que BTCUSD lo testee pronto. El rendimiento pasado no es indicativo de resultados futuros. Las pérdidas pueden exceder los fondos depositados.
EURJPY has broken through support
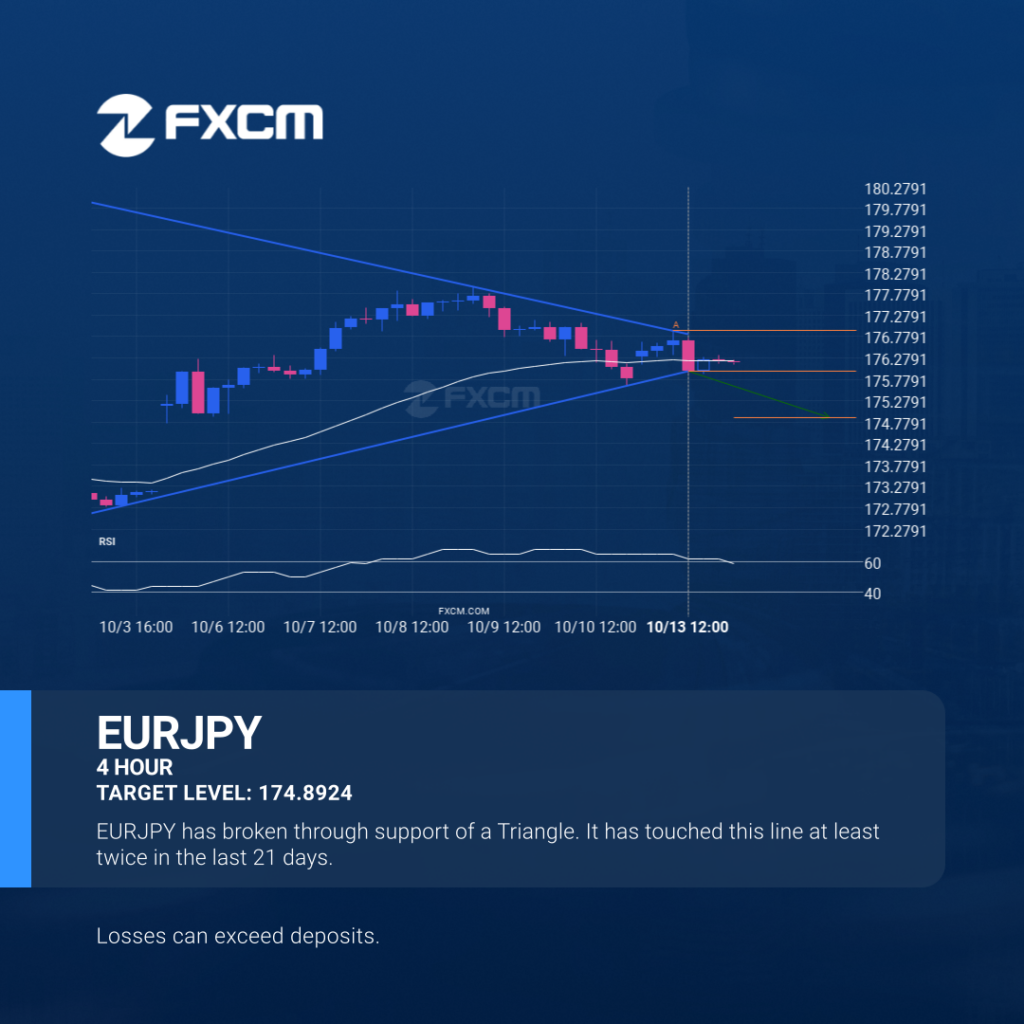
The last 21 4 hour candles on EURJPY formed a Triangle pattern and broken out through the pattern lines, indicating a possible bearish movement towards the price level of 174.8924. Past performance is not an indicator of future results. Losses can exceed deposits.
El EURJPY ha atravesado el soporte

Las últimas 21 velas de 4 Hora en EURJPY formaron un patrón de Triángulo y rompieron a través de las líneas del patrón, lo que indica un posible movimiento bajista hacia el nivel de precio en 174.8924. El rendimiento pasado no es indicativo de resultados futuros. Las pérdidas pueden exceder los fondos depositados.
Movimiento extremo en XAUUSD.
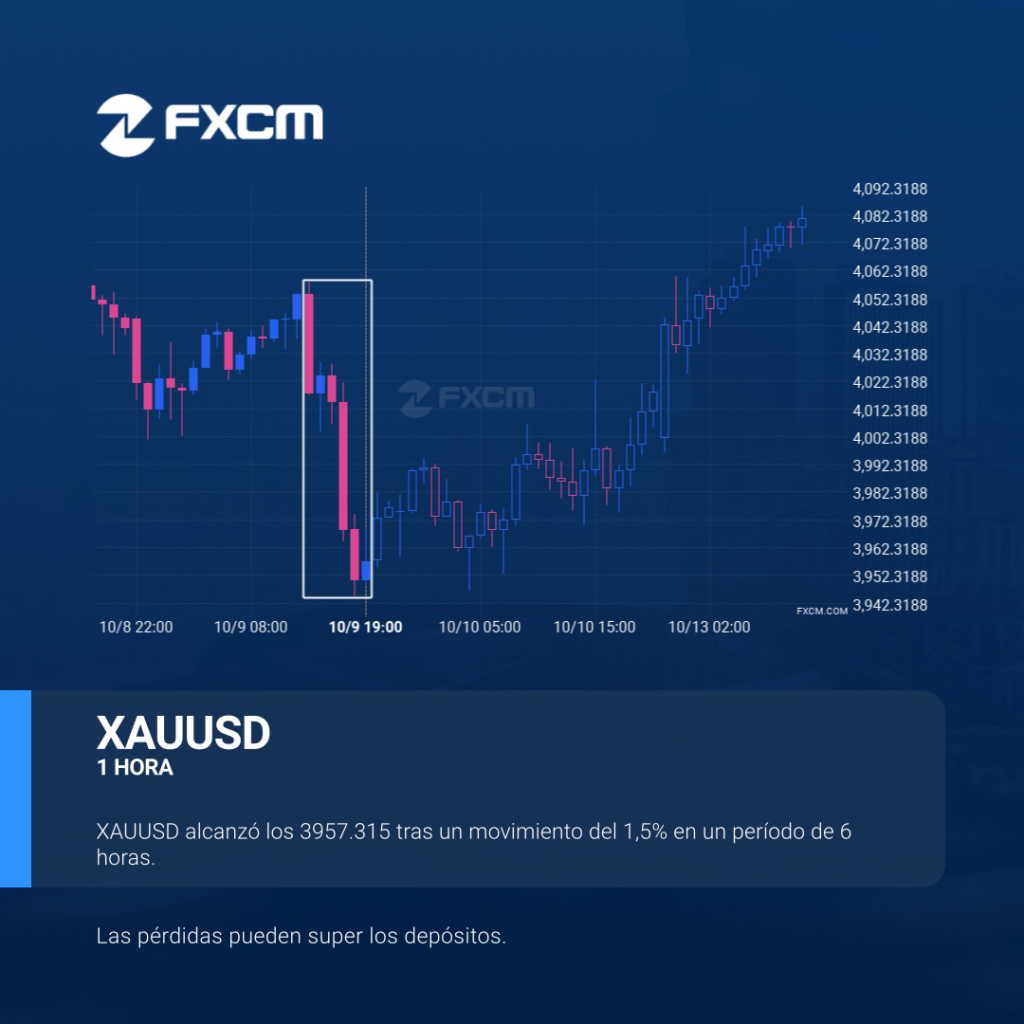
XAUUSD acaba de registrar un movimiento del 1,5% en los últimos 6 horas: un movimiento que no pasa desapercibido para ningún tipo de estrategia. El rendimiento pasado no es indicativo de resultados futuros. Las pérdidas pueden exceder los fondos depositados.
Extreme movement on XAUUSD
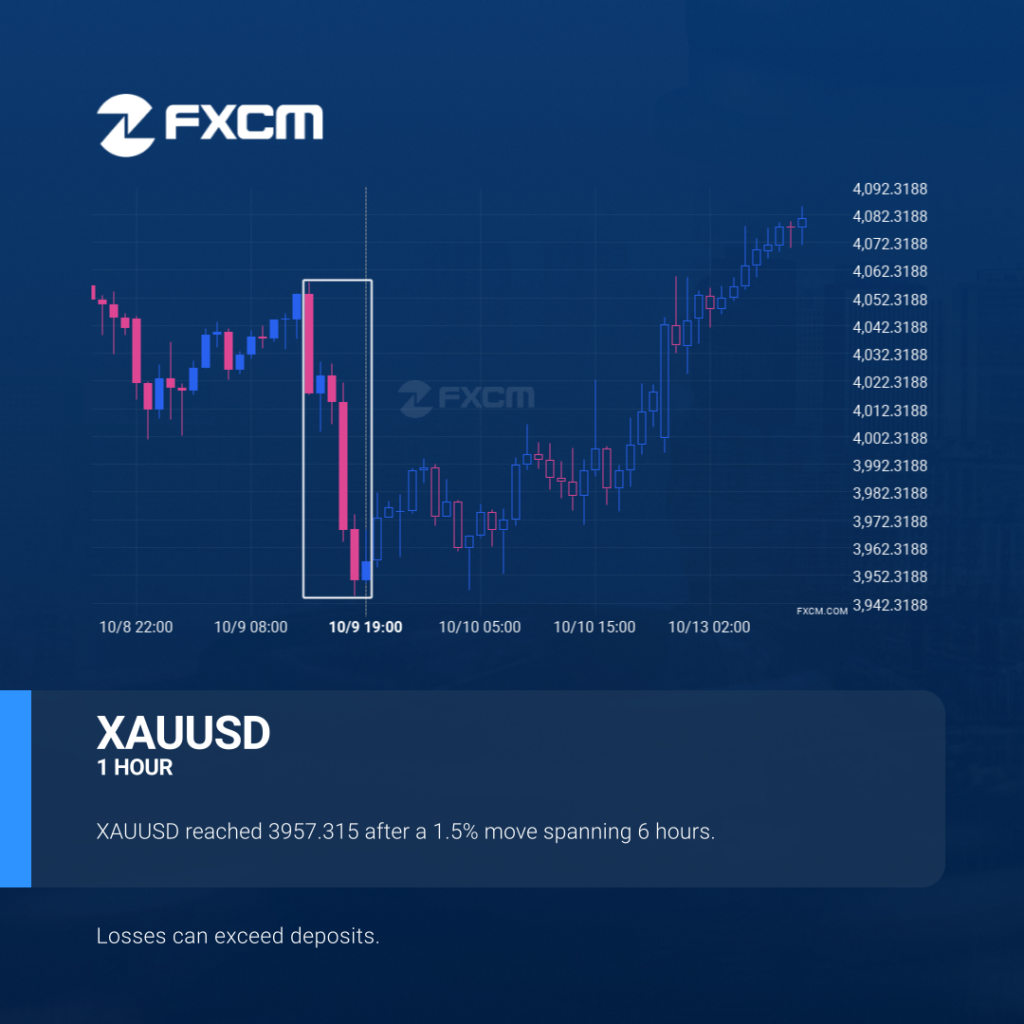
XAUUSD just posted a 1.5% move over the past 6 hours – a move that won’t go unnoticed by any trading style. Past performance is not an indicator of future results. Losses can exceed deposits.
Extreme movement on XAUUSD

XAUUSD just posted a 1.5% move over the past 6 hours – a move that won’t go unnoticed by any trading style. Past performance is not an indicator of future results. Trading leveraged products carries significant risk. Please refer to PDS and TMD on our website. AFSL#309763
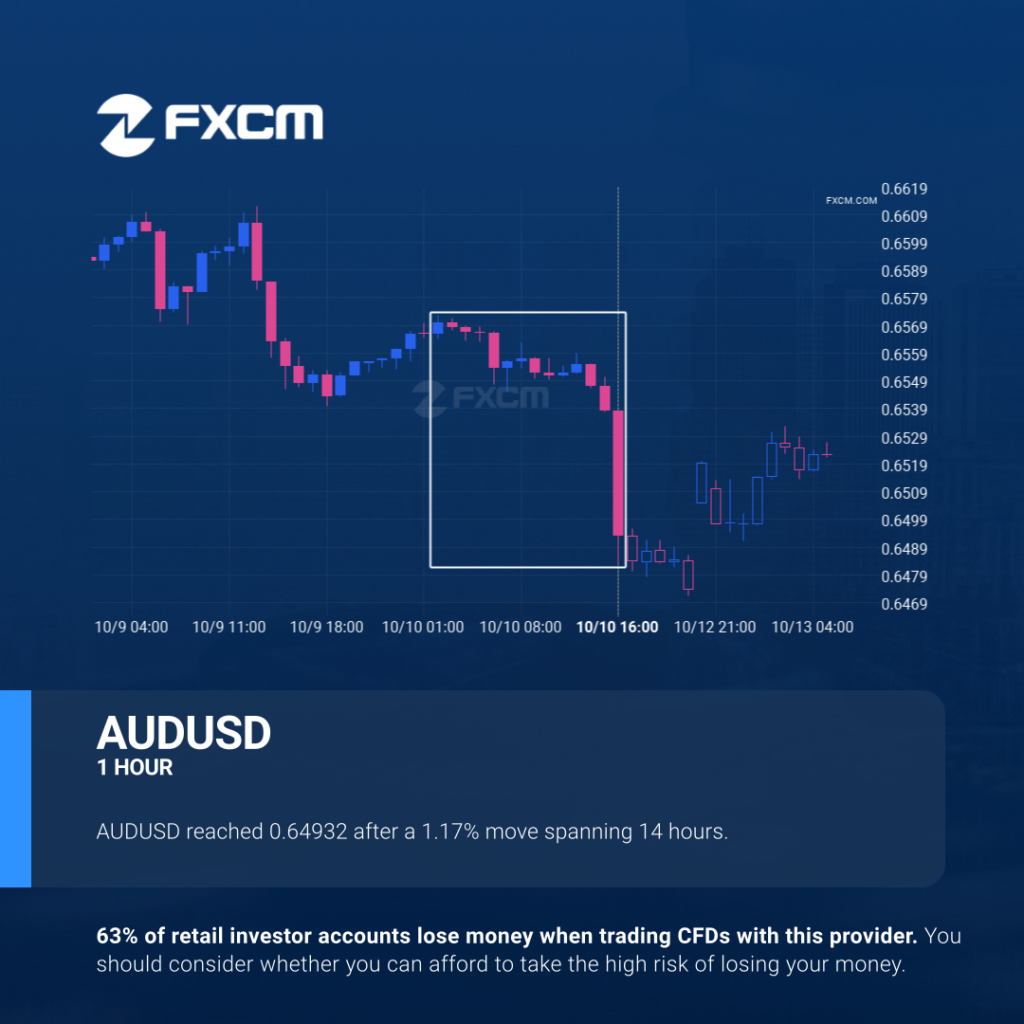
AUDUSD is on its way down

AUDUSD reached 0.64932 after a 1.17% move spanning 14 hours. Past performance is not an indicator of future results. Trading leveraged products carries significant risk. Please refer to PDS and TMD on our website. AFSL#309763
AUDUSD is on its way down
AUDUSD reached 0.64932 after a 1.17% move spanning 14 hours. Past performance is not an indicator of future results. Trading leveraged products carries significant risk. Please refer to PDS and TMD on our website. AFSL#309763