USDJPY se mueve al alza durante 3 días.
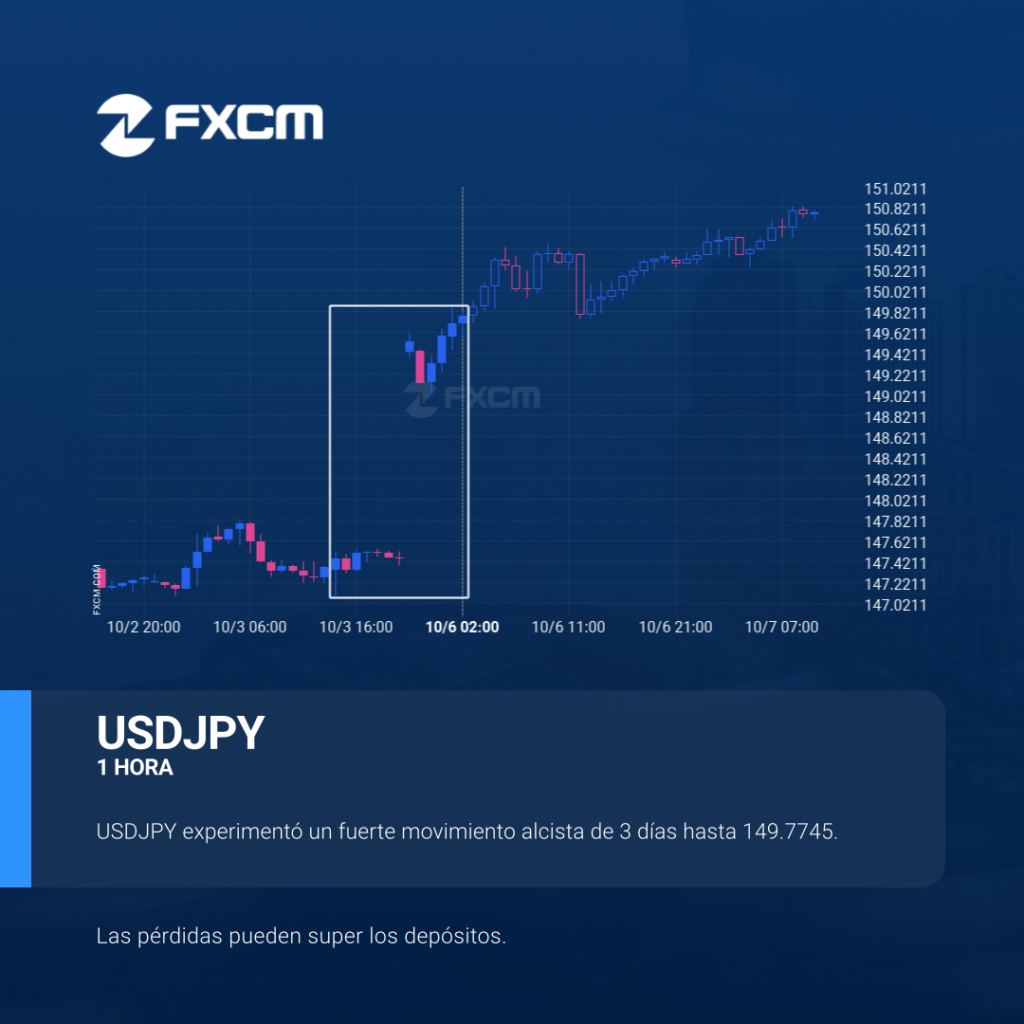
USDJPY se ha movido al alza un 1,58% desde 147.4485 hasta 149.7745 en los últimos 3 días. El rendimiento pasado no es indicativo de resultados futuros. Las pérdidas pueden exceder los fondos depositados.
BTCUSD acercándose a nivel de soporte
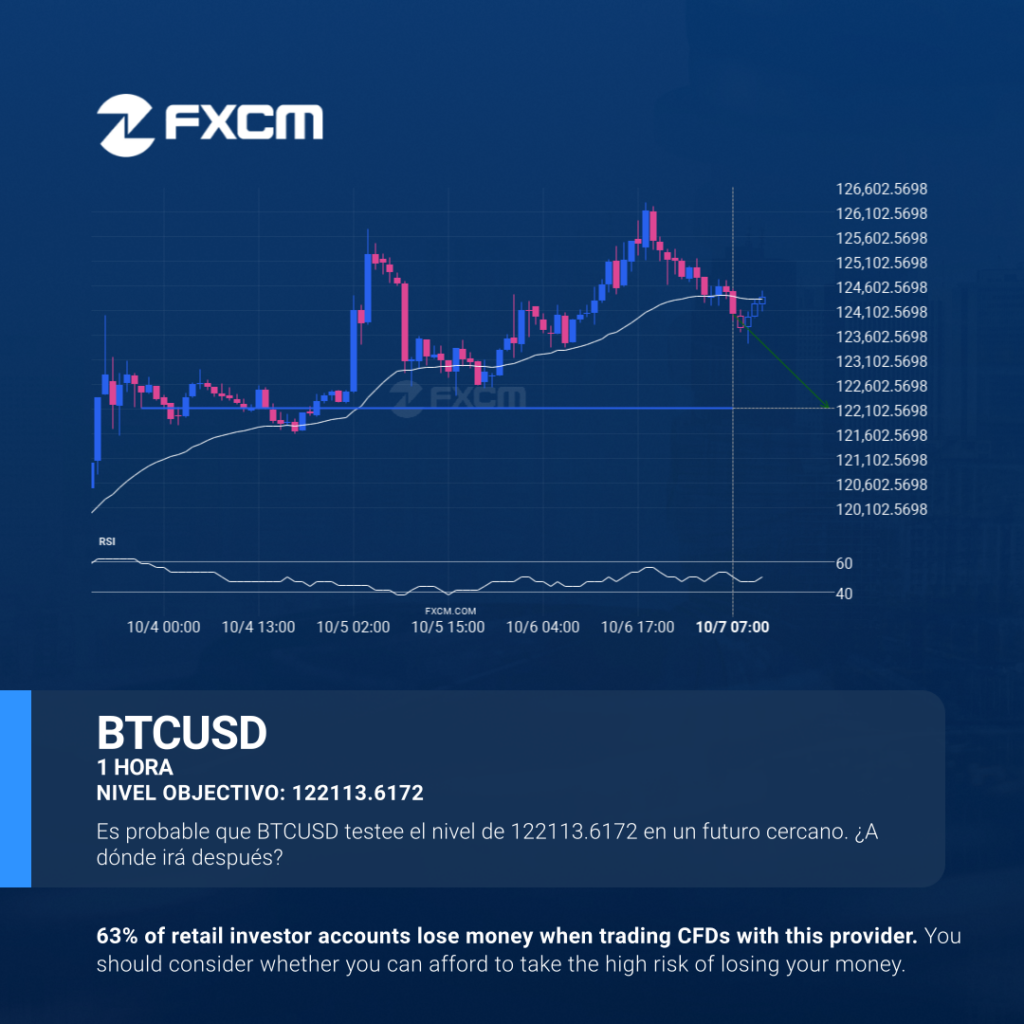
BTCUSD se está moviendo hacia un nivel clave de soporte en 122113.6172. BTCUSD testeó previamente este nivel 4 veces y en cada ocasión rebotó en este nivel. ¿Ha llegado finalmente el momento de la rotura? El rendimiento pasado no es indicativo de resultados futuros. Las pérdidas pueden exceder los fondos depositados.
A potential bearish movement on HKG33
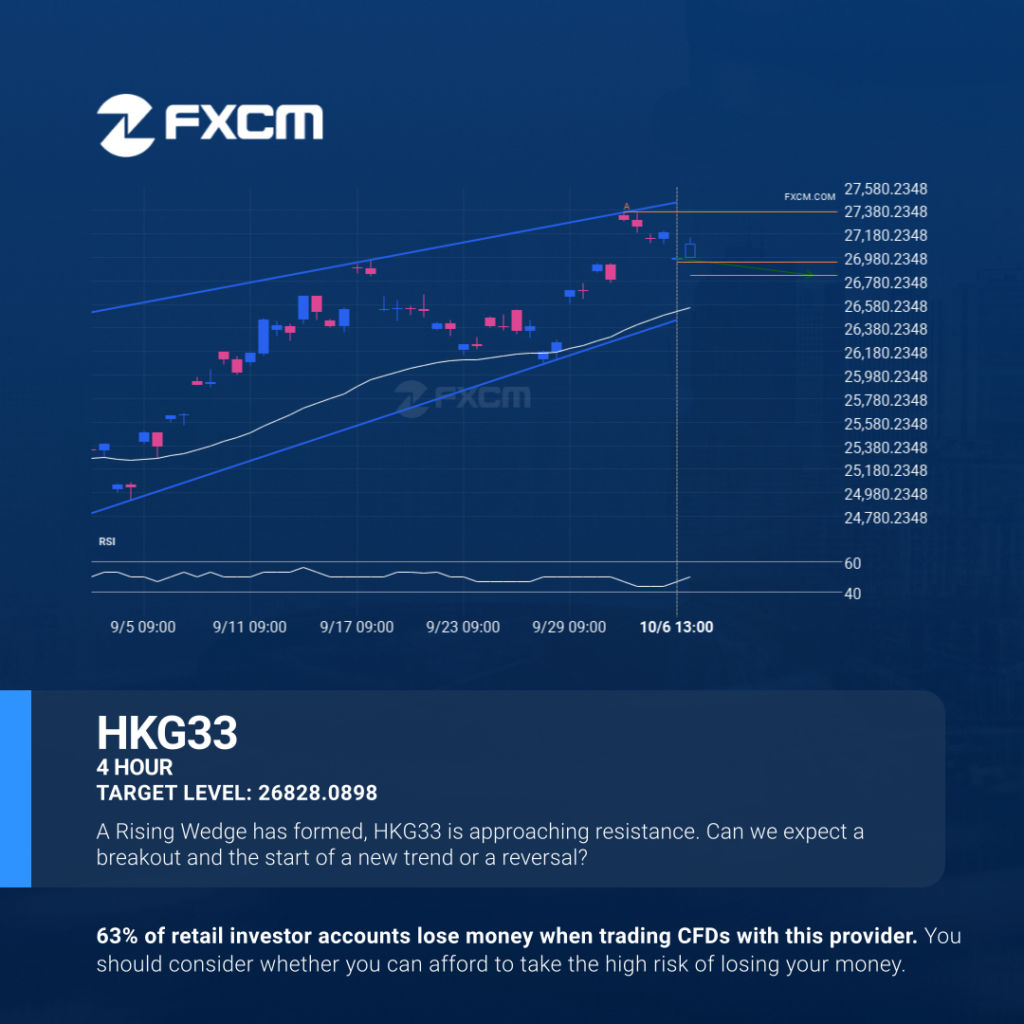
The movement of HKG33 towards the support line of a Rising Wedge is yet another test of the line it reached numerous times in the past. This line test could happen in the next 2 days, but it is uncertain whether it will result in a breakout through this line, or simply rebound back to […]
USDJPY upward for 3 days.
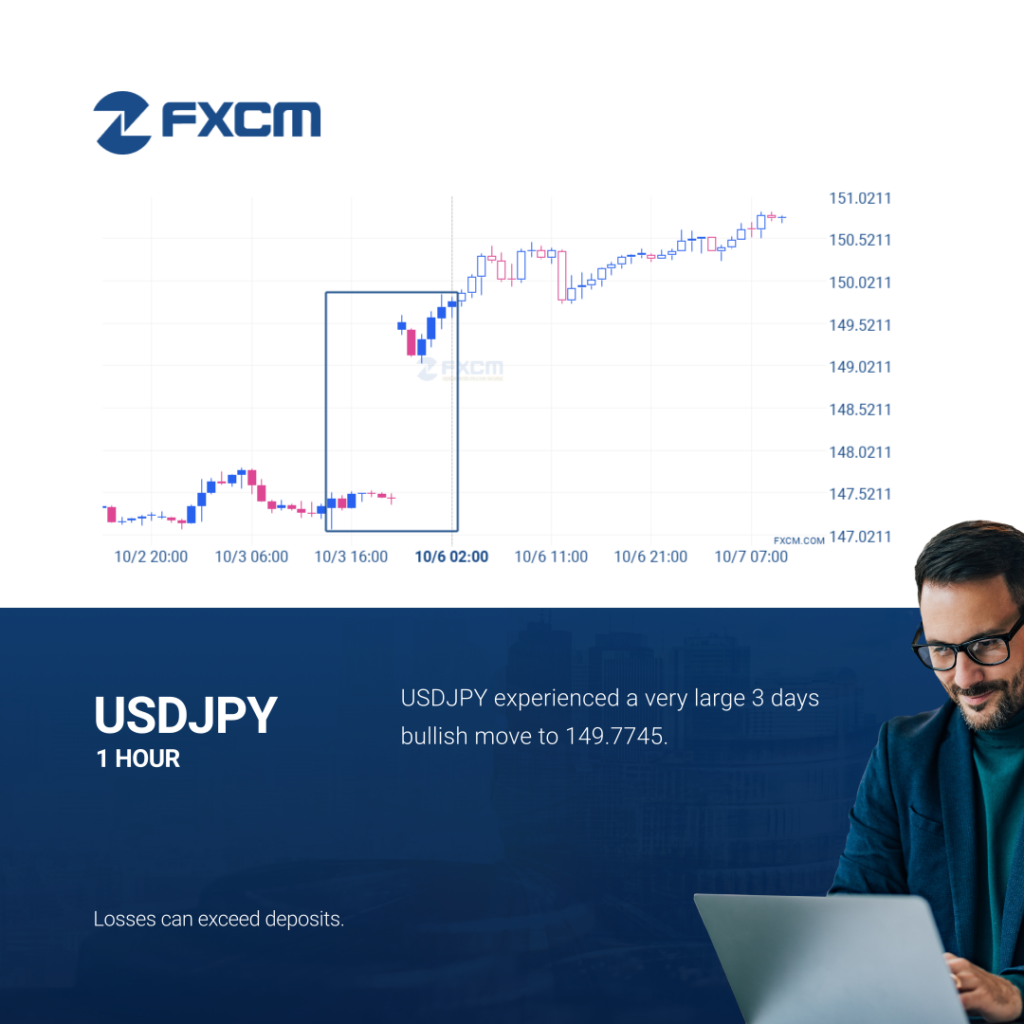
USDJPY has moved higher by 1.58% from 147.4485 to 149.7745 in the last 3 days. Past performance is not an indicator of future results. Losses can exceed deposits.
A potential bearish movement on HKG33

The movement of HKG33 towards the support line of a Rising Wedge is yet another test of the line it reached numerous times in the past. This line test could happen in the next 2 days, but it is uncertain whether it will result in a breakout through this line, or simply rebound back to […]
HKG33 – Patrón de gráfico Continuation – Cuña ascendente
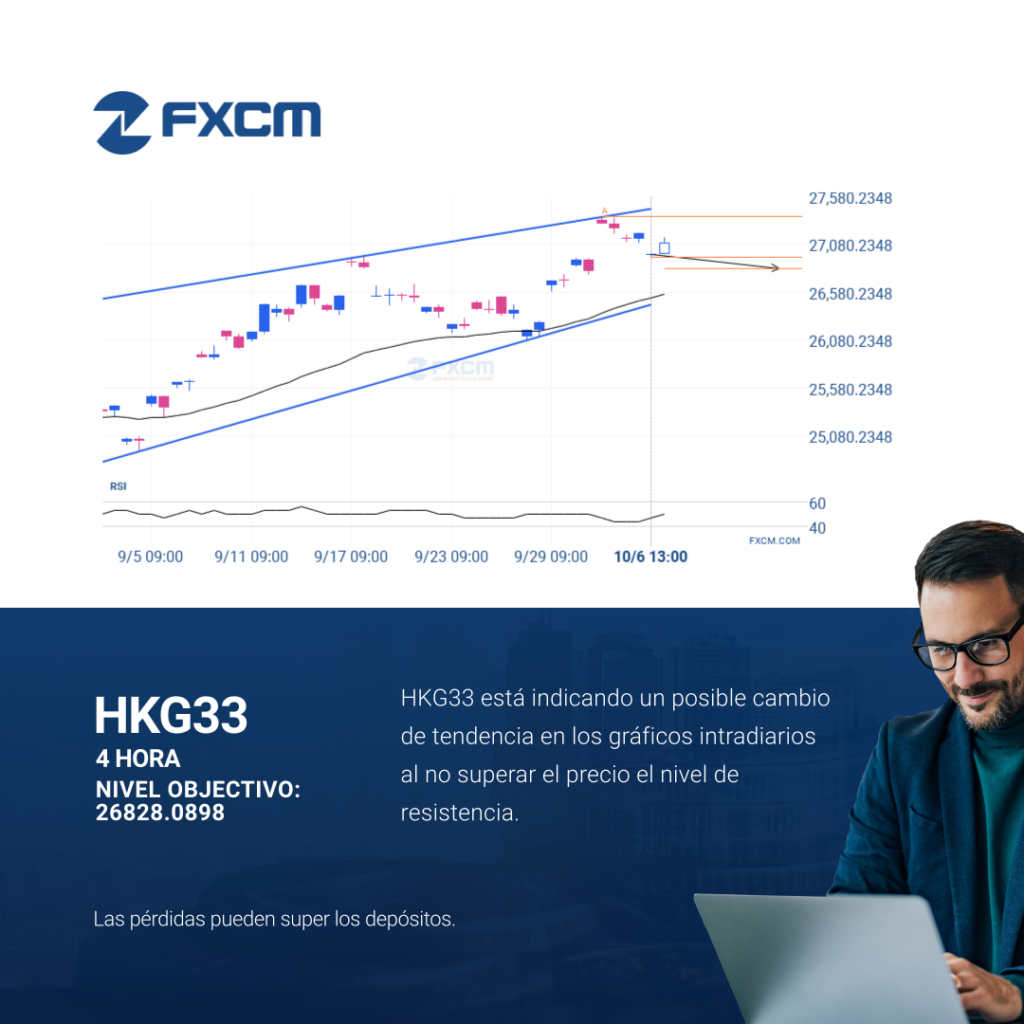
El movimiento del HKG33 hacia la línea de soporte de un Cuña ascendente es otra prueba más de la línea que ha alcanzado en numerosas ocasiones durante el pasado. Esta prueba de la línea podría ocurrir en las próximas 2 días, pero no sabemos si dará como resultado una ruptura a través de esta línea […]
XAGUSD mostró un movimiento alcista durante la sesión.

XAGUSD acaba de registrar un movimiento del 27,23% en los últimos 48 días: un movimiento que no pasa desapercibido para ningún tipo de estrategia. El rendimiento pasado no es indicativo de resultados futuros. Las pérdidas pueden exceder los fondos depositados.
XAGUSD showed a move upward during the session.
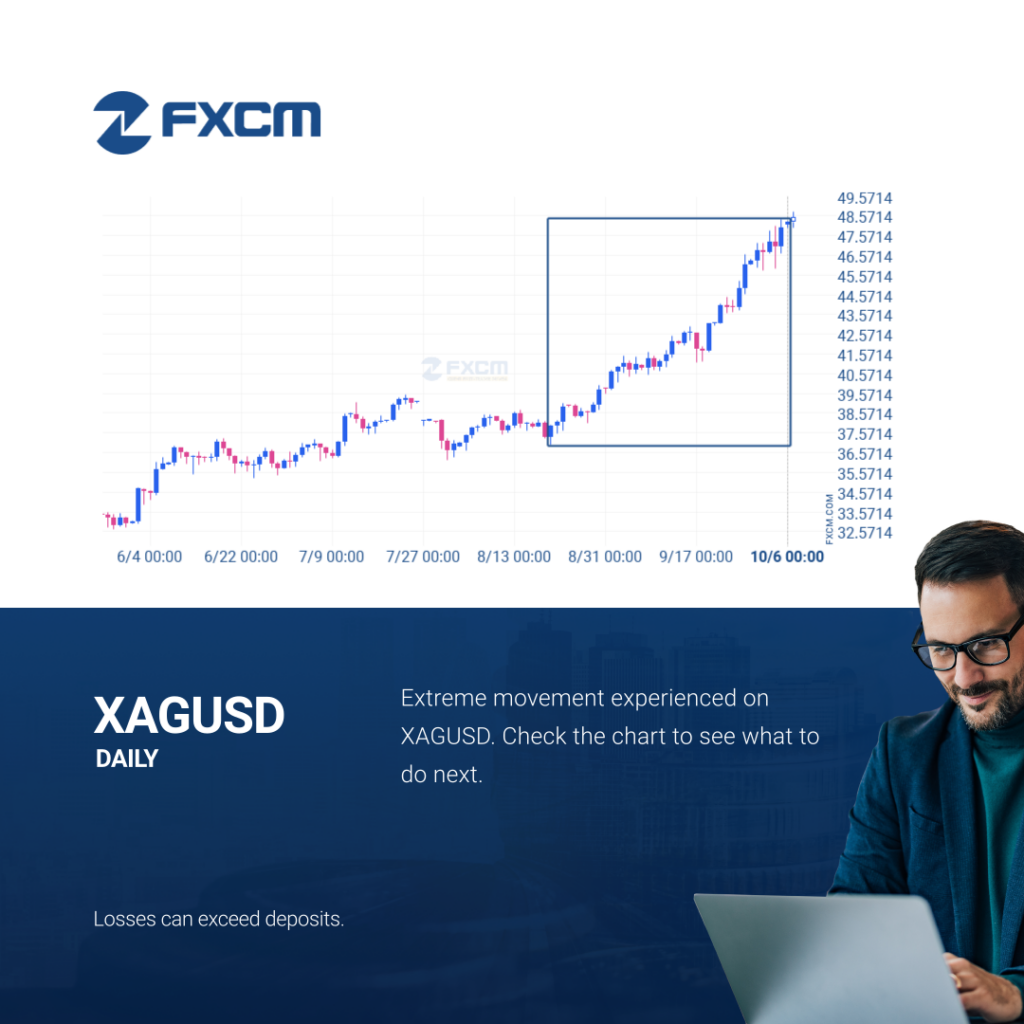
XAGUSD just posted a 27.23% move over the past 48 days – a move that won’t go unnoticed by any trading style. Past performance is not an indicator of future results. Losses can exceed deposits.
XAGUSD showed a move upward during the session.
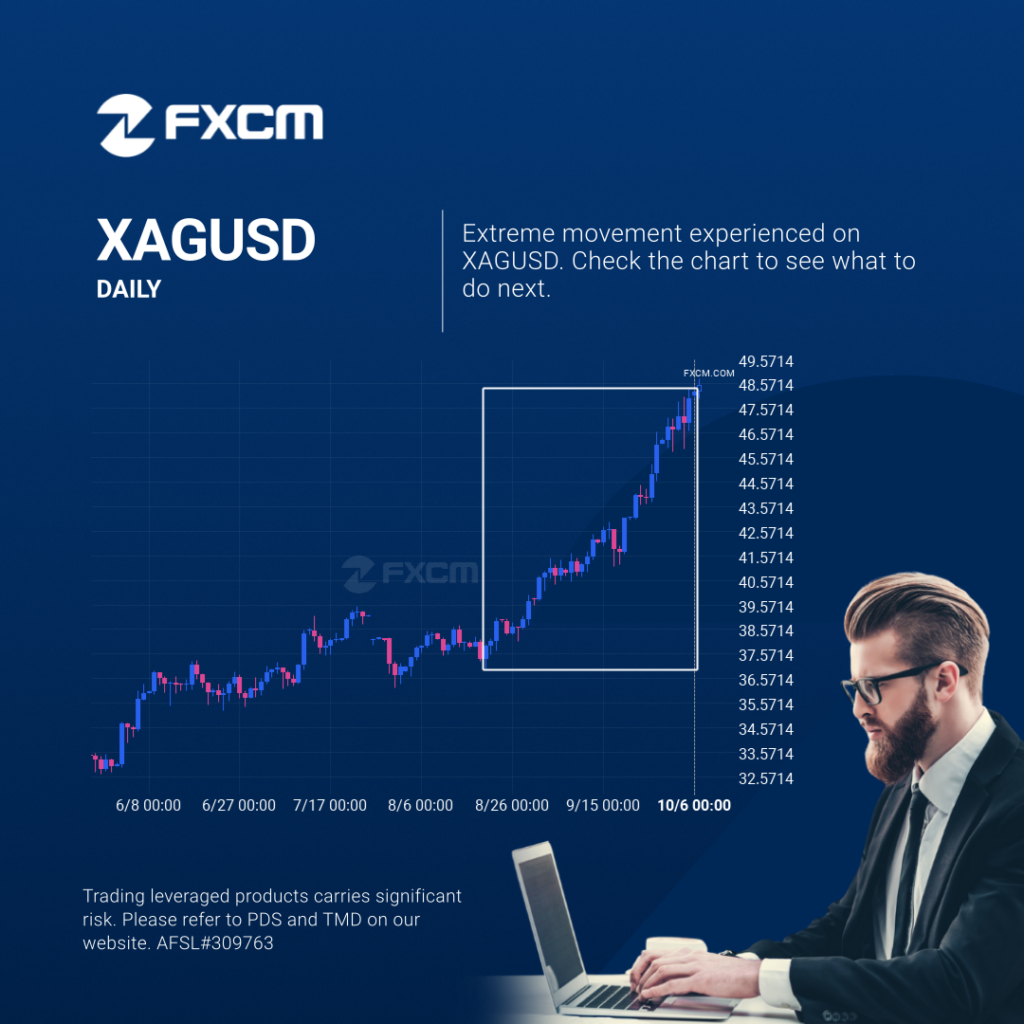
XAGUSD just posted a 27.23% move over the past 48 days – a move that won’t go unnoticed by any trading style. Past performance is not an indicator of future results. Trading leveraged products carries significant risk. Please refer to PDS and TMD on our website. AFSL#309763
A potential bearish movement on ESP35

ESP35 is heading towards a line of 15480.4102. If this movement continues, the price of ESP35 could test 15480.4102 within the next 11 hours. But don’t be so quick to trade, it has tested this line numerous times in the past, so this movement could be short-lived and end up rebounding. Past performance is not […]