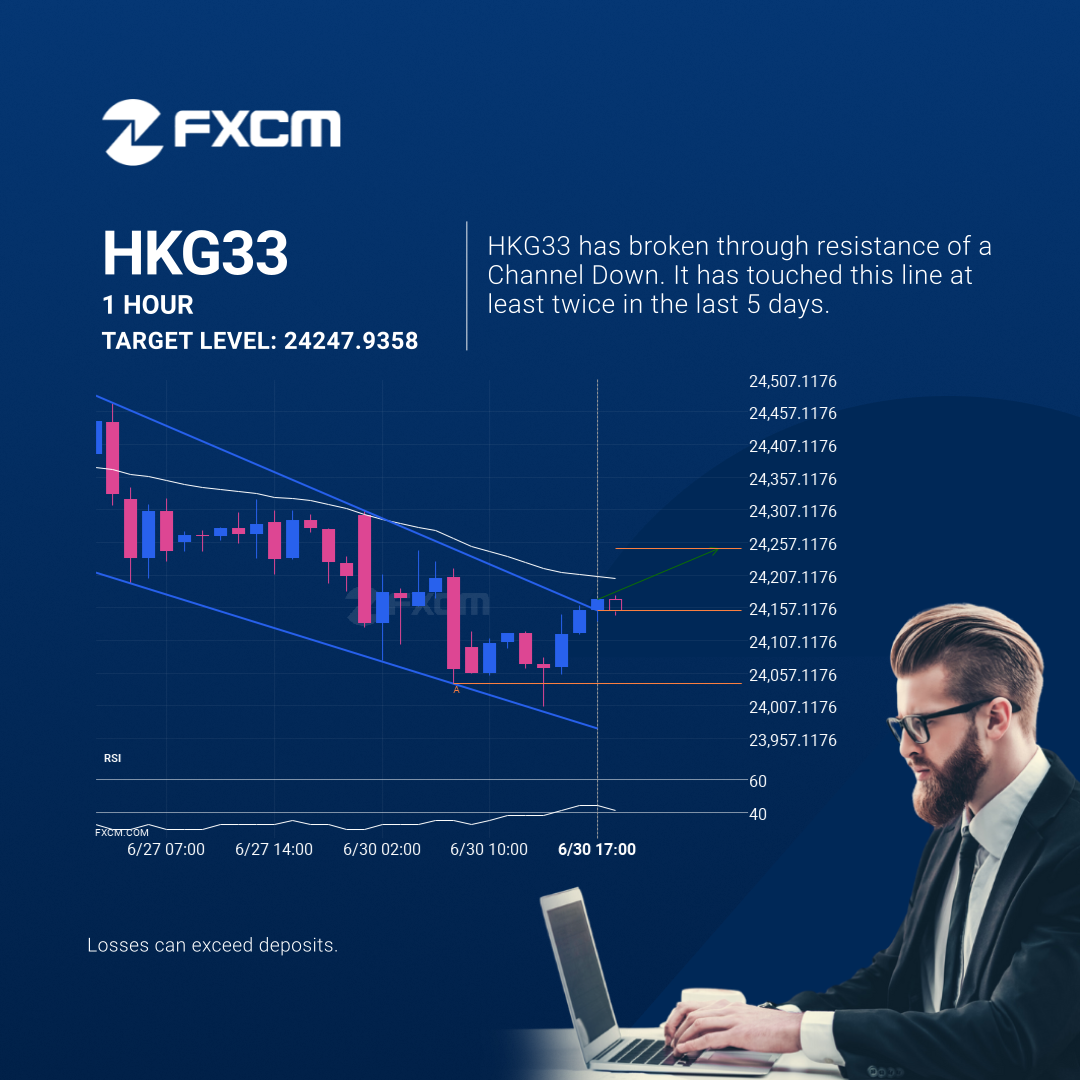
A possible start of a bullish trend on HKG33

HKG33 has broken through a resistance line of a Ascending Triangle chart pattern. If this breakout holds true, we may see the price of HKG33 testing 20361.3723 within the next 4 days. But don’t be so quick to trade, it has tested this line in the past, so you should confirm the breakout before taking any action.

Past performance is not an indicator of future results.
71% of retail investor accounts lose money when trading CFDs with this provider. You should consider whether you can afford to take the high risk of losing your money.