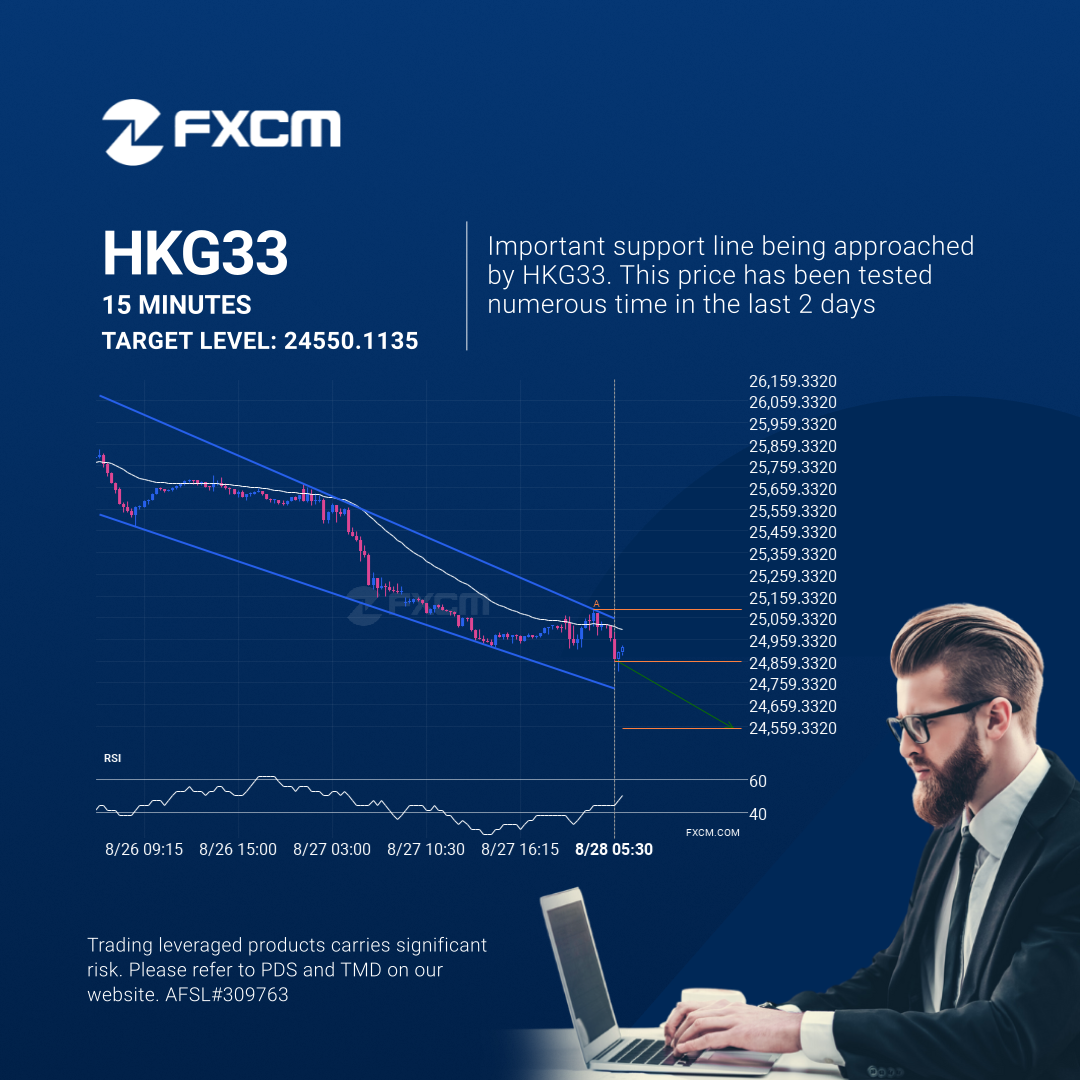
HKG33 is moving towards a support line which it has tested numerous times in the past. We have seen it retrace from this line before, so at this stage it isn’t clear whether it will breach this line or rebound as it did before. If HKG33 continues in its current trajectory, we could see it reach 24550.1135 within the next 9 hours.
Past performance is not an indicator of future results.
Trading leveraged products carries significant risk. Please refer to PDS and TMD on our website. AFSL#309763
