Índices de Análisis Técnico
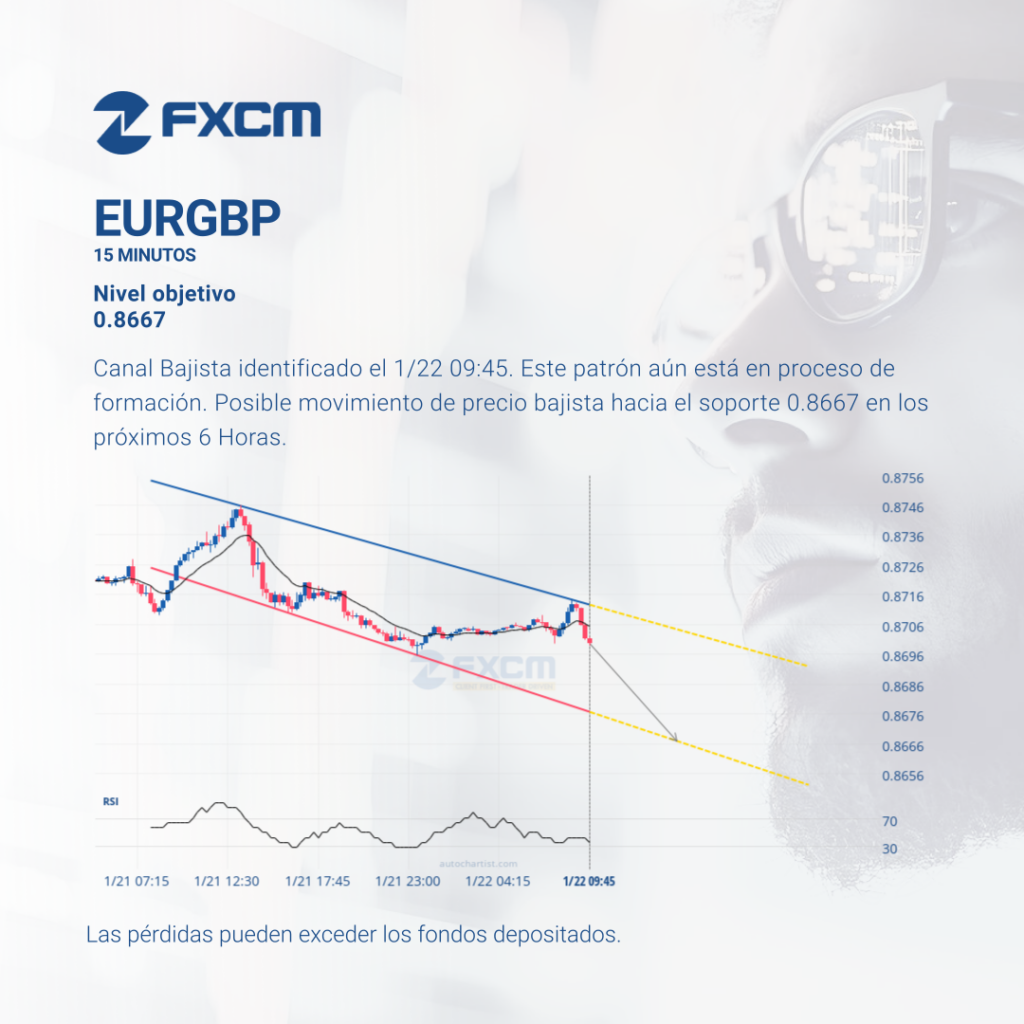
Canal Bajista identificado el 1/22 09:45. Este patrón aún está en proceso de formación. Posible movimiento de precio bajista hacia el soporte 0.8667 en los próximos 6 Horas. Las pérdidas pueden exceder los depósitos.
Technical Analysis Indices

Channel Down identified at 1/22 09:45. This pattern is still in the process of forming. Possible bearish price movement towards the support 0.8667 within the next 6 hours. Past performance is not an indicator of future results. Trading leveraged products carries significant risk. Please refer to PDS and TMD on our website. AFSL#309763
Technical Analysis Forex

Broke through Resistance level of 158.28 at 1/21 20:00. Possible bullish price movement forecast for the next 1 day towards 158.96. Past performance is not an indicator of future results. Losses can exceed deposits.
Technical Analysis Indices
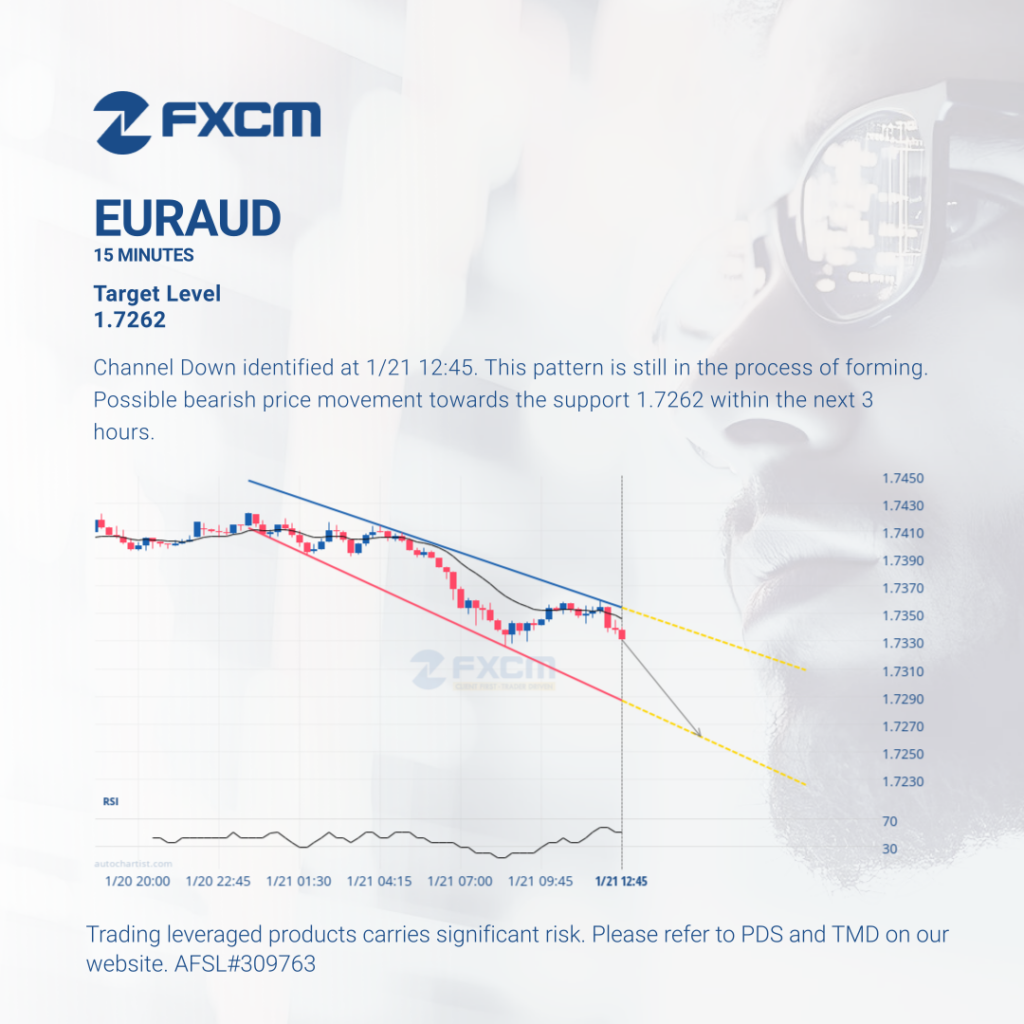
Channel Down identified at 1/21 12:45. This pattern is still in the process of forming. Possible bearish price movement towards the support 1.7262 within the next 3 hours. Past performance is not an indicator of future results. Trading leveraged products carries significant risk. Please refer to PDS and TMD on our website. AFSL#309763
Technical Analysis Forex

Ascending Triangle has broken through the resistance line at 1/21 12:30. Possible bullish price movement forecast for the next 5 hours towards 0.5869. Past performance is not an indicator of future results. Losses can exceed deposits.
Technical Analysis Forex
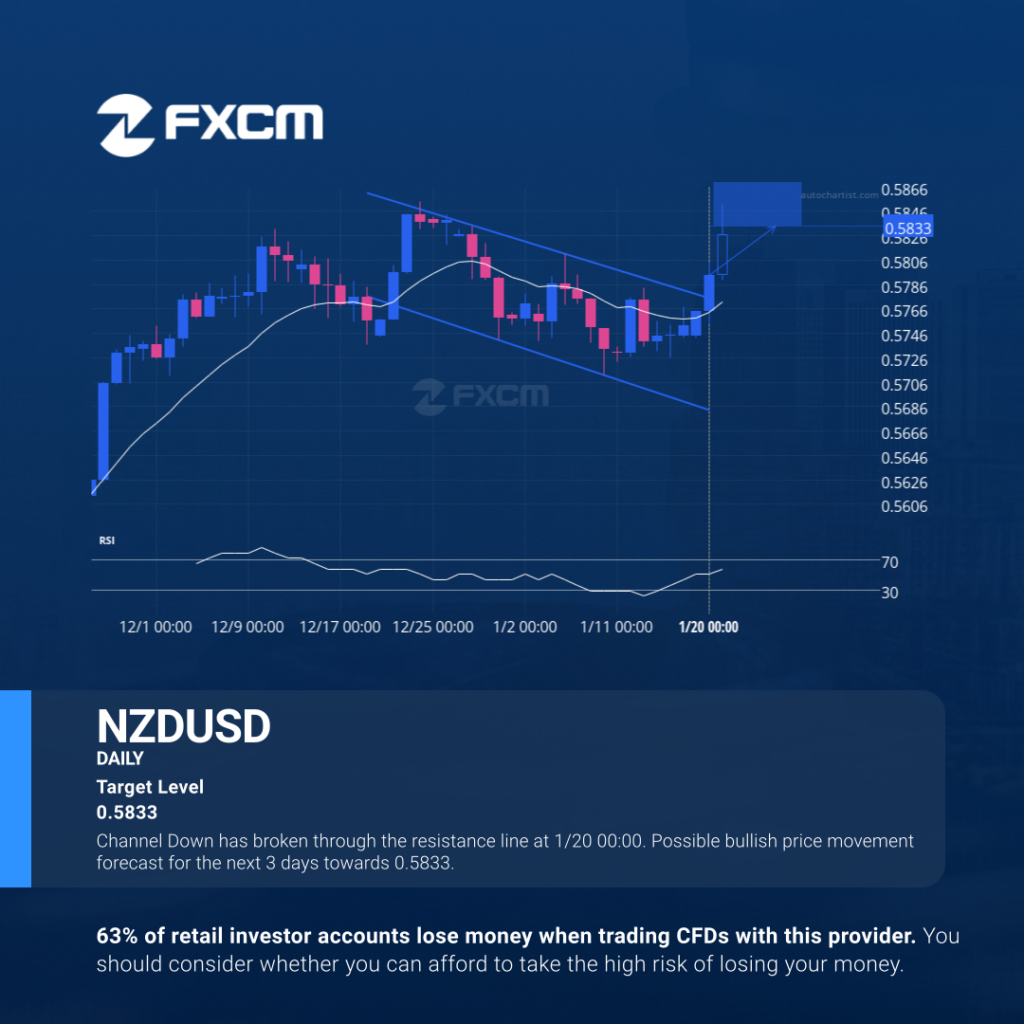
Channel Down has broken through the resistance line at 1/20 00:00. Possible bullish price movement forecast for the next 3 days towards 0.5833. Past performance is not an indicator of future results. Losses can exceed deposits.
Índices de Análisis Técnico
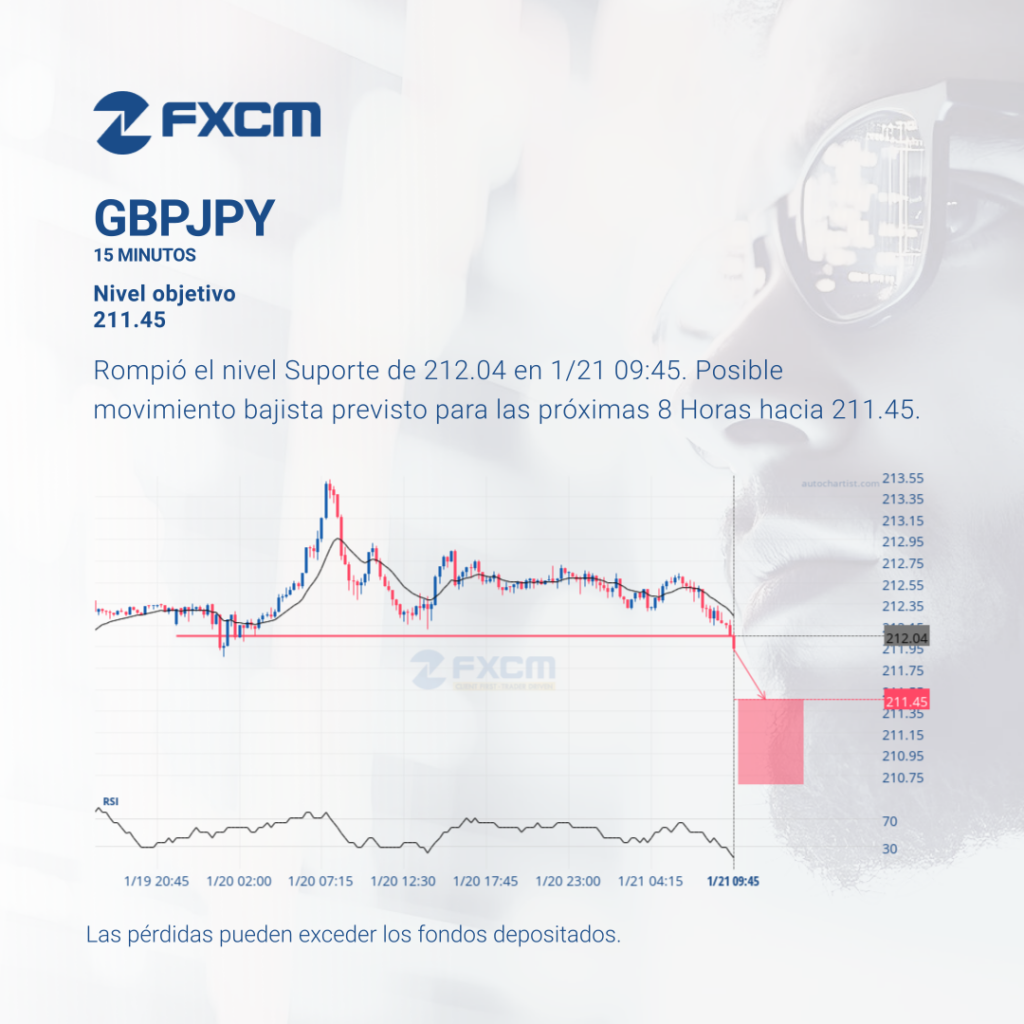
Rompió el nivel Suporte de 212.04 en 1/21 09:45. Posible movimiento bajista previsto para las próximas 8 Horas hacia 211.45. Las pérdidas pueden exceder los depósitos.
Technical Analysis Indices
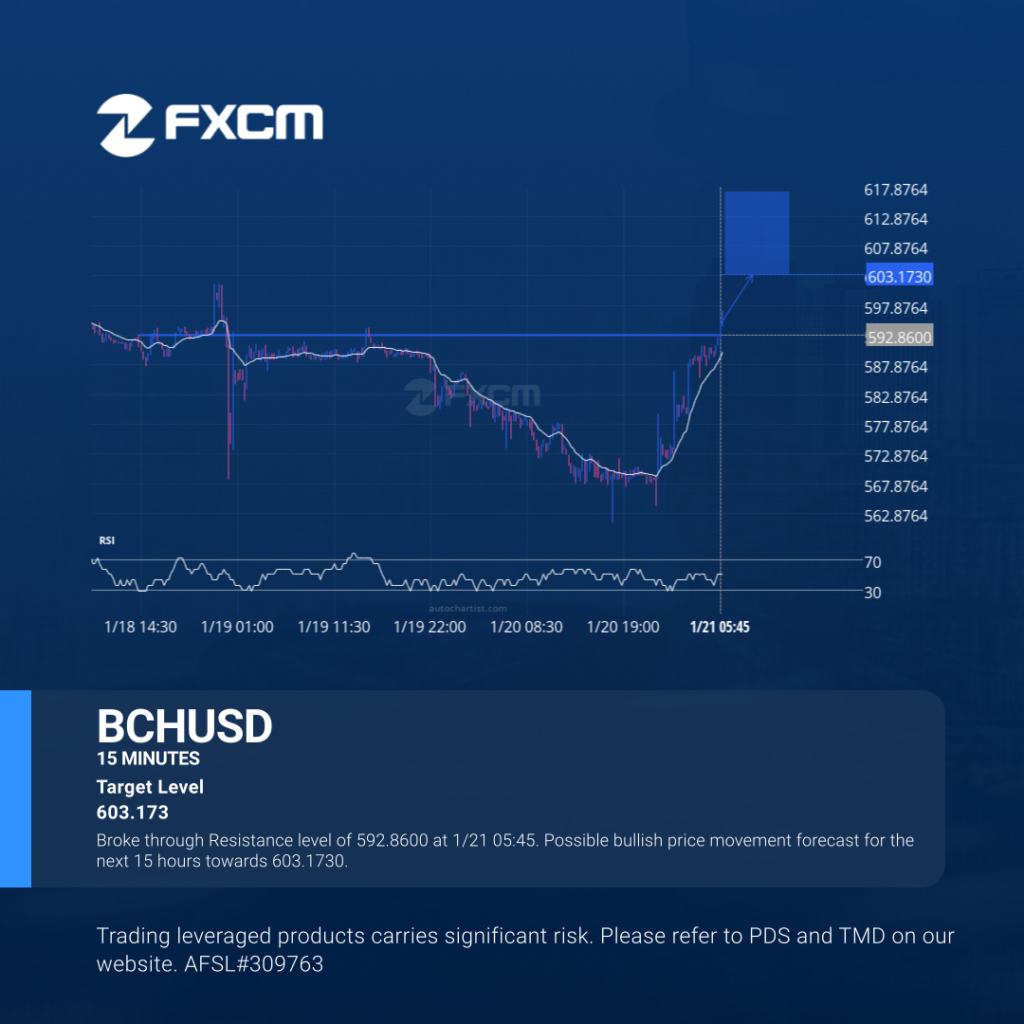
Broke through Resistance level of 592.8600 at 1/21 05:45. Possible bullish price movement forecast for the next 15 hours towards 603.1730. Past performance is not an indicator of future results. Trading leveraged products carries significant risk. Please refer to PDS and TMD on our website. AFSL#309763
Análisis Técnico Cripto
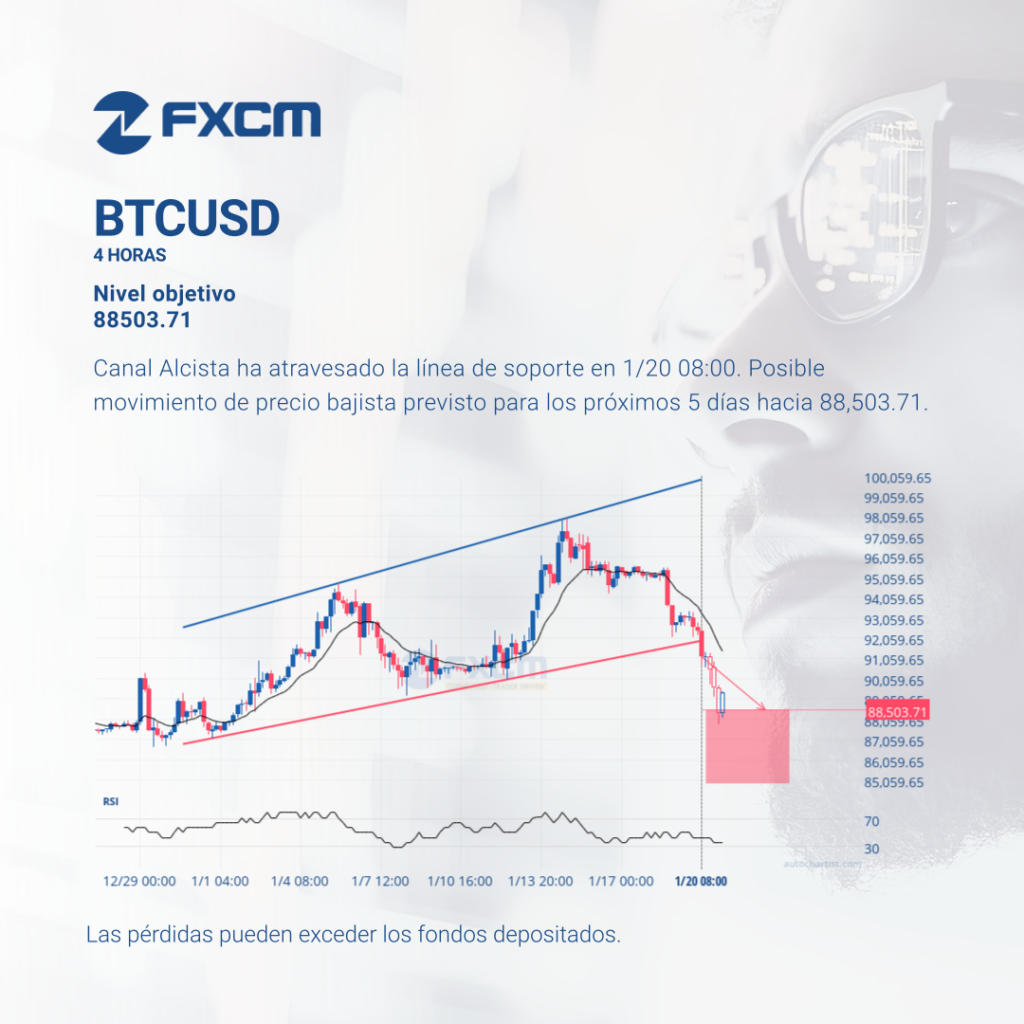
Canal Alcista ha atravesado la línea de soporte en 1/20 08:00. Posible movimiento de precio bajista previsto para los próximos 5 días hacia 88,503.71. El rendimiento pasado no es indicativo de resultados futuros. Las pérdidas pueden exceder los depósitos.
Análisis Técnico Cripto

Cuña Descendente ha atravesado la línea de resistencia en 1/20 12:45. Posible movimiento de precio alcista previsto para los próximos 6 Horas hacia 8,059.60. El rendimiento pasado no es indicativo de resultados futuros. Las pérdidas pueden exceder los depósitos.