Índices de Análisis Técnico
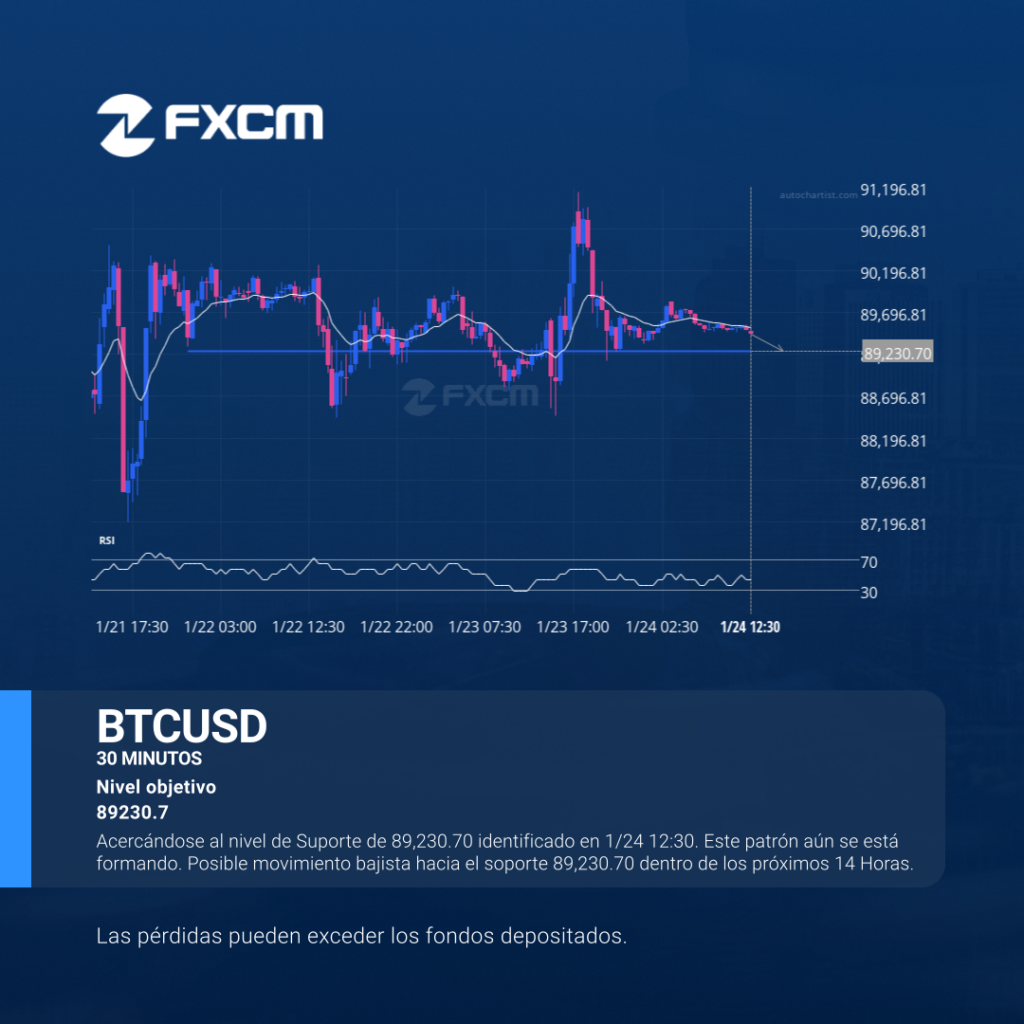
Acercándose al nivel de Suporte de 89,230.70 identificado en 1/24 12:30. Este patrón aún se está formando. Posible movimiento bajista hacia el soporte 89,230.70 dentro de los próximos 14 Horas. Las pérdidas pueden exceder los depósitos.
Análisis Técnico Cripto
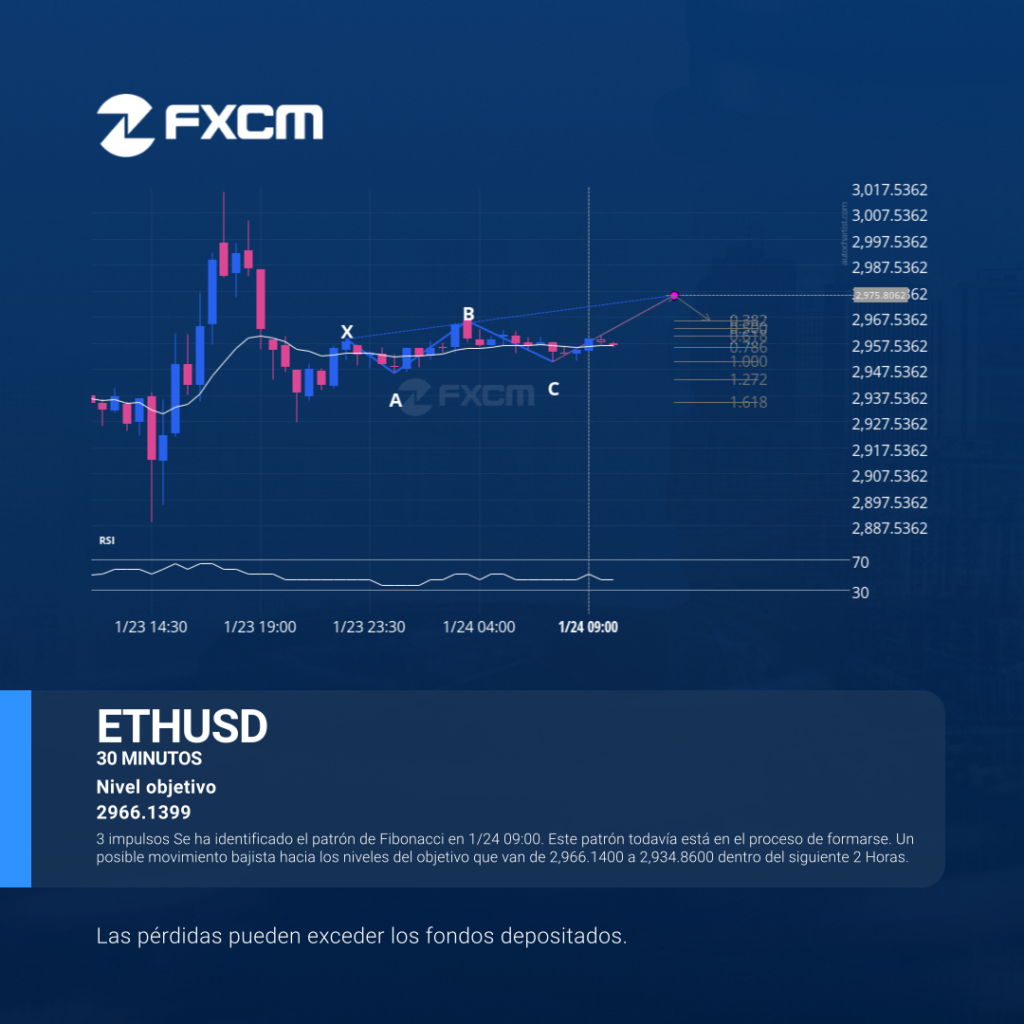
3 impulsos Se ha identificado el patrón de Fibonacci en 1/24 09:00. Este patrón todavía está en el proceso de formarse. Un posible movimiento bajista hacia los niveles del objetivo que van de 2,966.1400 a 2,934.8600 dentro del siguiente 2 Horas. El rendimiento pasado no es indicativo de resultados futuros. Las pérdidas pueden exceder los depósitos.
Índices de Análisis Técnico
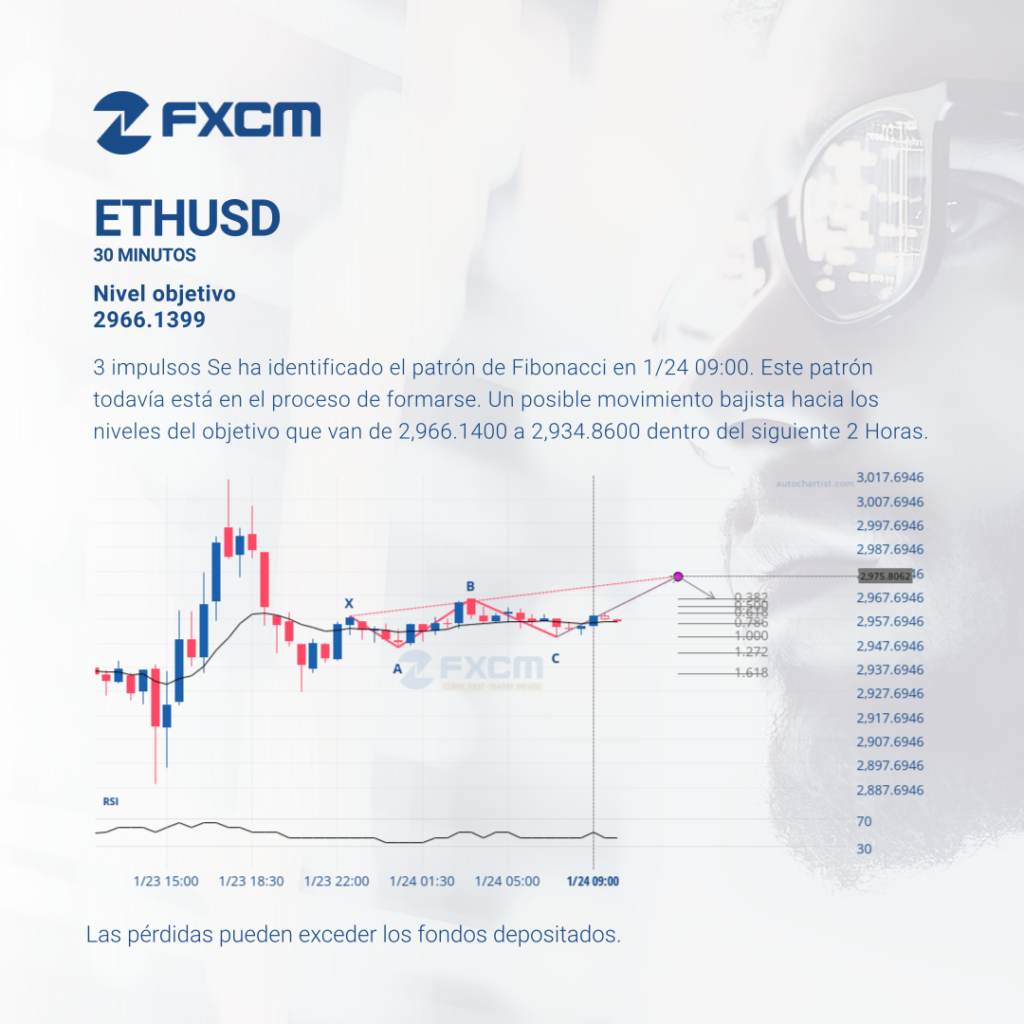
3 impulsos Se ha identificado el patrón de Fibonacci en 1/24 09:00. Este patrón todavía está en el proceso de formarse. Un posible movimiento bajista hacia los niveles del objetivo que van de 2,966.1400 a 2,934.8600 dentro del siguiente 2 Horas. Las pérdidas pueden exceder los depósitos.
Technical Analysis Indices

3 Drive Fibonacci pattern identified at 1/24 09:00. This pattern is still in the process of forming. Possible bearish price movement towards target levels ranging from 2,966.1400 to 2,934.8600 within the next 2 hours. Past performance is not an indicator of future results. Trading leveraged products carries significant risk. Please refer to PDS and TMD […]
Índices de Análisis Técnico
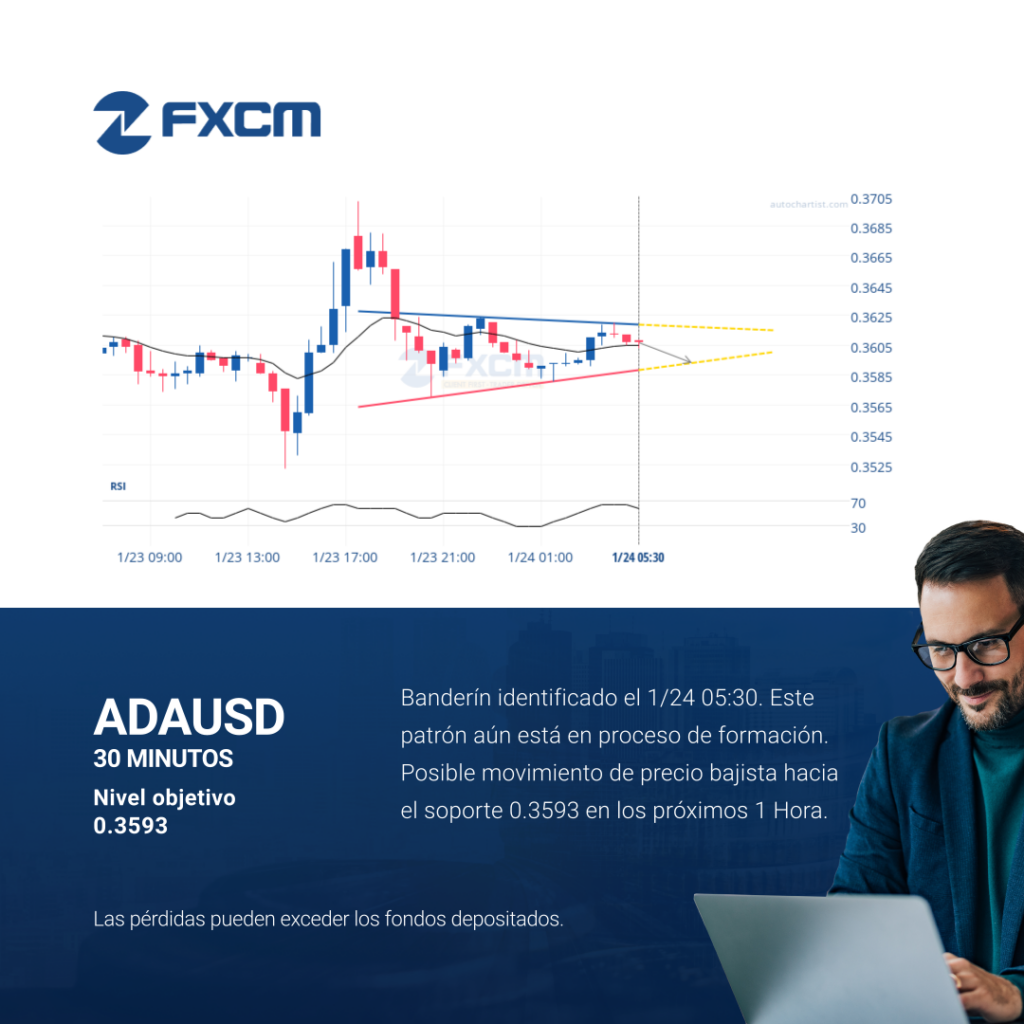
Banderín identificado el 1/24 05:30. Este patrón aún está en proceso de formación. Posible movimiento de precio bajista hacia el soporte 0.3593 en los próximos 1 Hora. Las pérdidas pueden exceder los depósitos.
Technical Analysis Forex
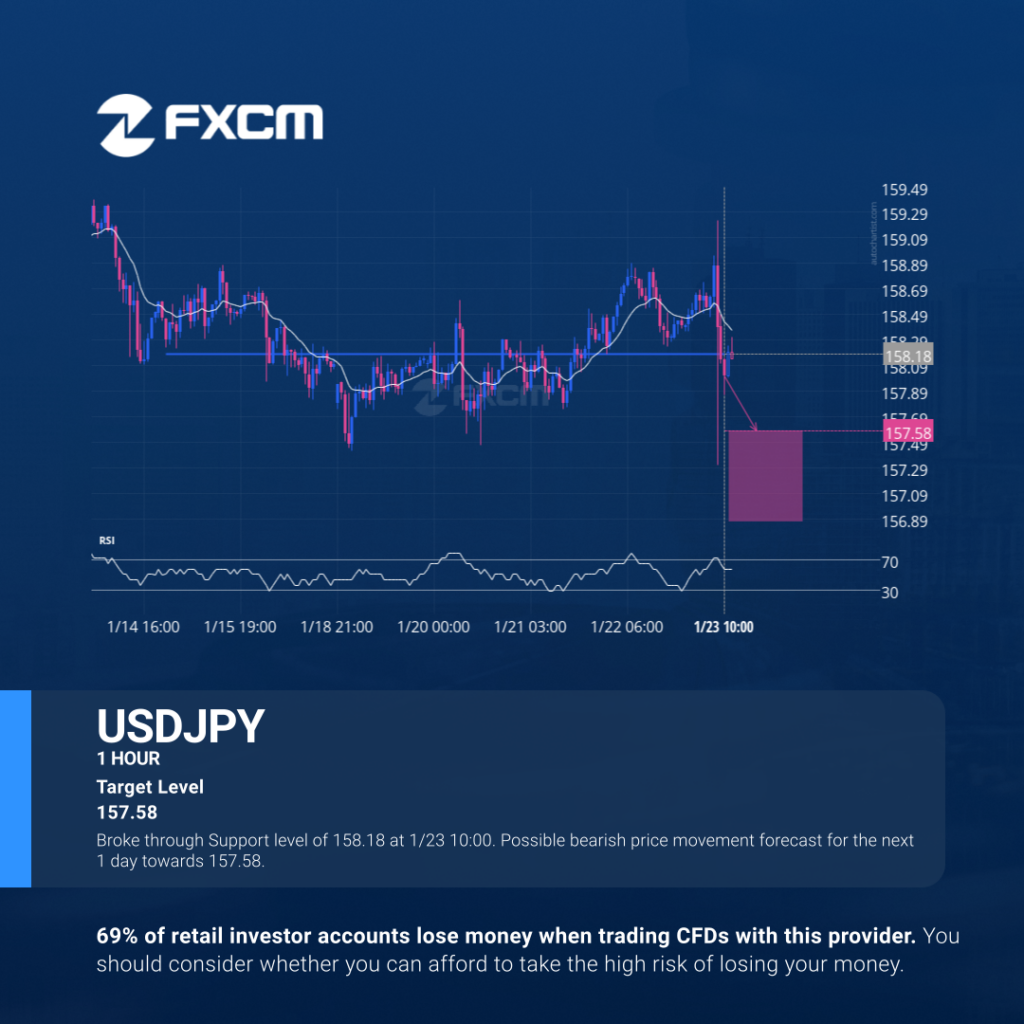
Broke through Support level of 158.18 at 1/23 10:00. Possible bearish price movement forecast for the next 1 day towards 157.58. Past performance is not an indicator of future results. Losses can exceed deposits.
Análisis Técnico Forex

Rompió el nivel Suporte de 158.18 en 1/23 10:00. Posible movimiento bajista previsto para las próximas 1 día hacia 157.58. El rendimiento pasado no es indicativo de resultados futuros. Las pérdidas pueden exceder los depósitos.
Índices de Análisis Técnico
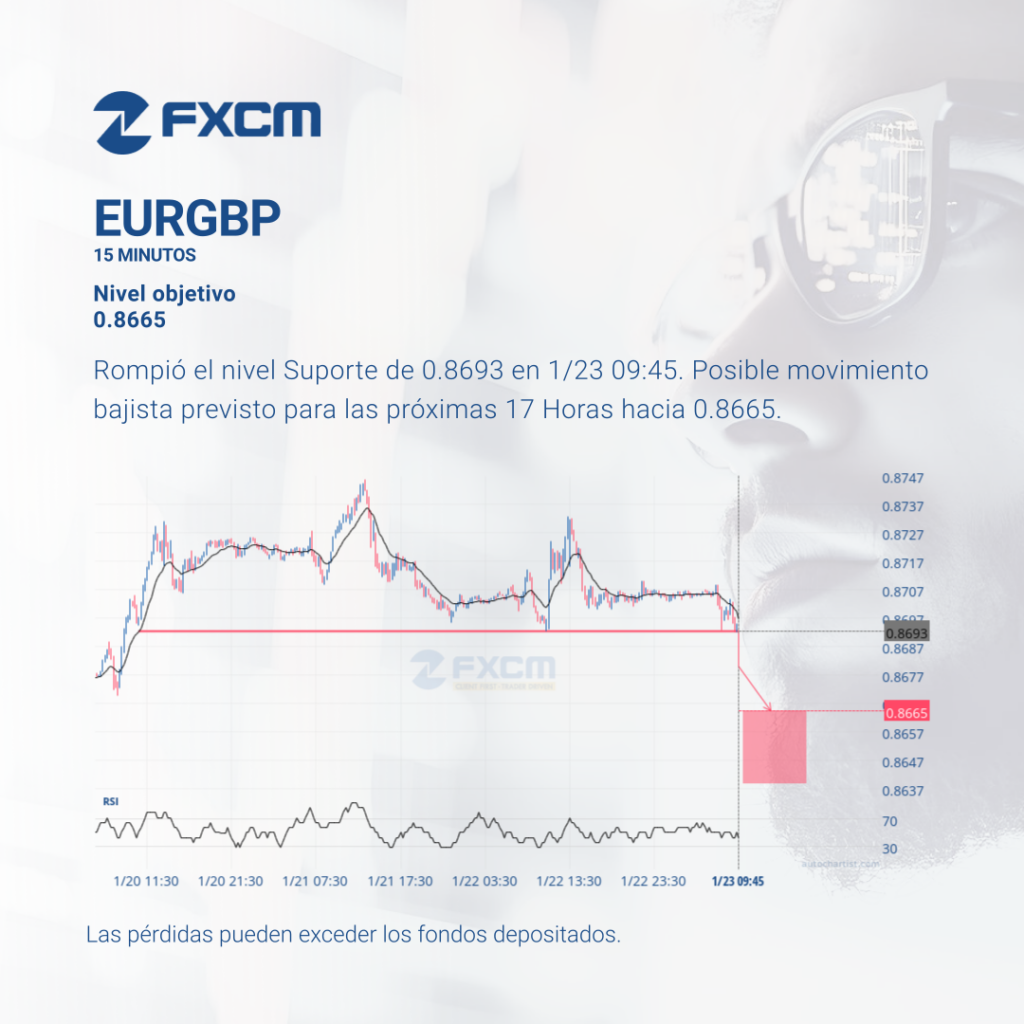
Rompió el nivel Suporte de 0.8693 en 1/23 09:45. Posible movimiento bajista previsto para las próximas 17 Horas hacia 0.8665. Las pérdidas pueden exceder los depósitos.
Análisis Técnico Cripto
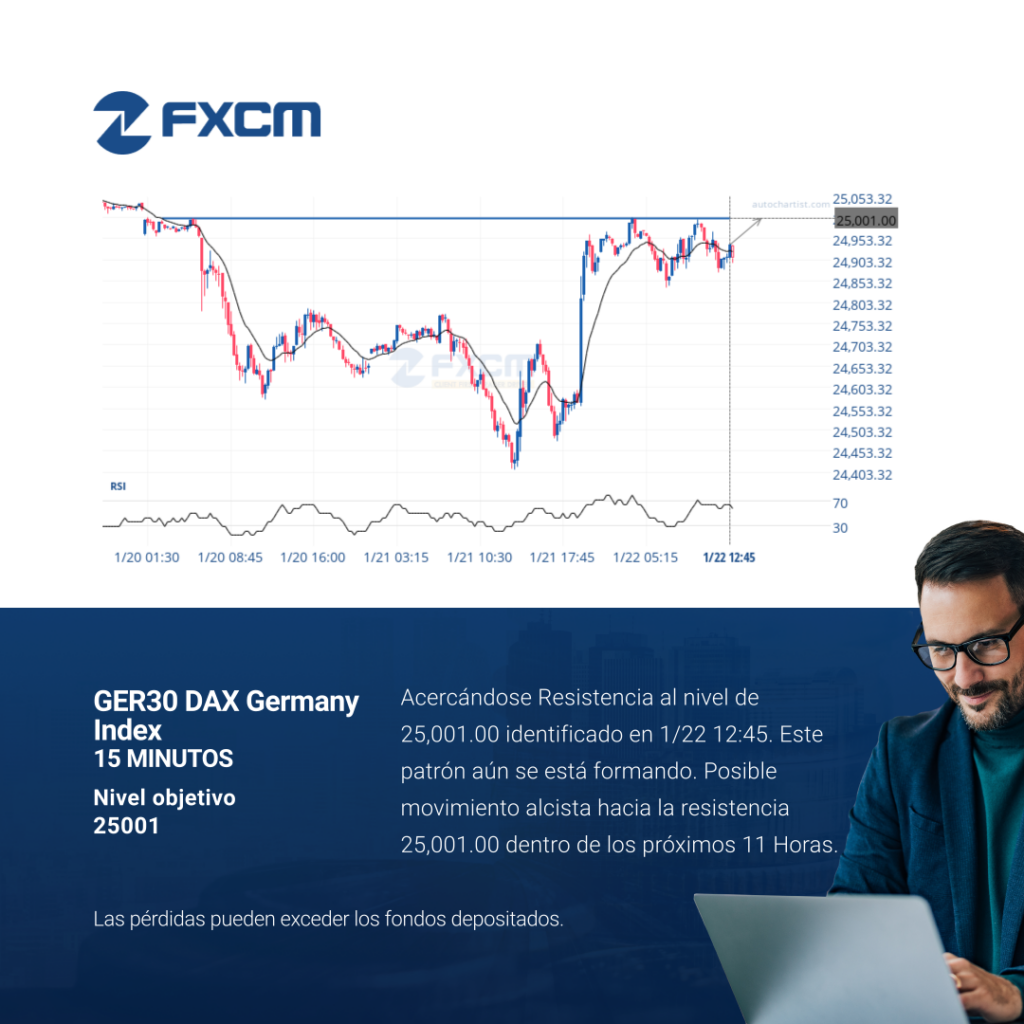
Acercándose Resistencia al nivel de 25,001.00 identificado en 1/22 12:45. Este patrón aún se está formando. Posible movimiento alcista hacia la resistencia 25,001.00 dentro de los próximos 11 Horas. El rendimiento pasado no es indicativo de resultados futuros. Las pérdidas pueden exceder los depósitos.
Technical Analysis Indices
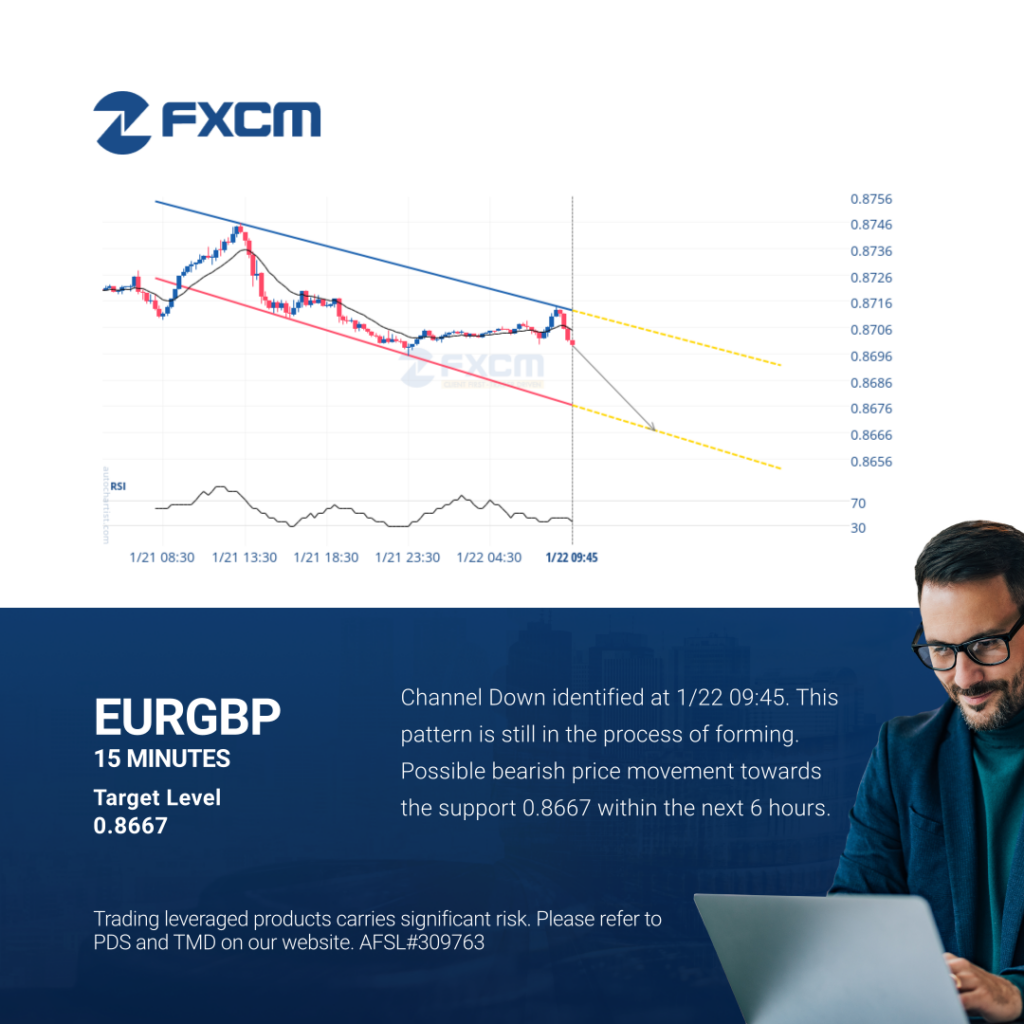
Channel Down identified at 1/22 09:45. This pattern is still in the process of forming. Possible bearish price movement towards the support 0.8667 within the next 6 hours. Past performance is not an indicator of future results. Trading leveraged products carries significant risk. Please refer to PDS and TMD on our website. AFSL#309763