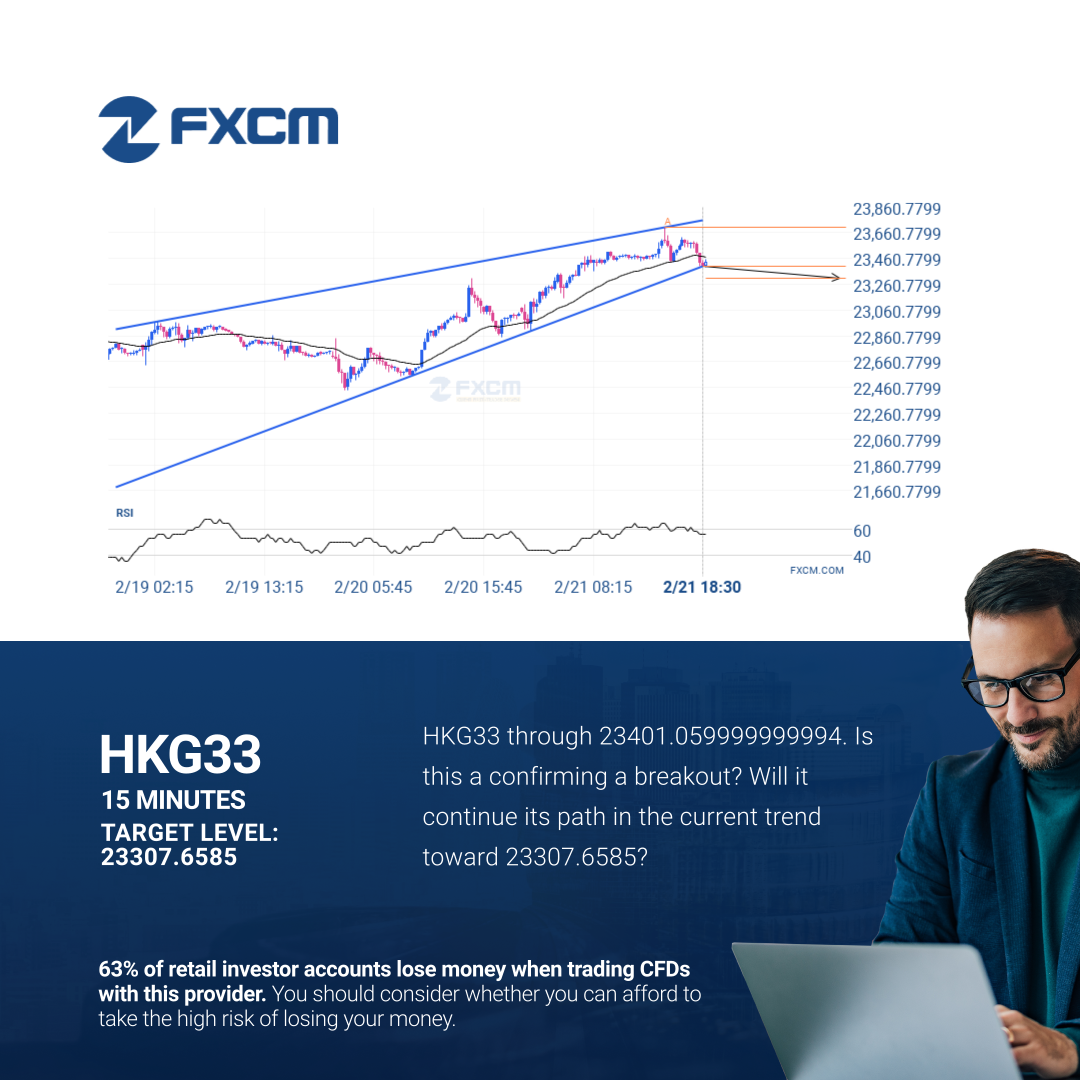
HKG33 has broken through a support line of a Rising Wedge and suggests a possible movement to 23307.6585 within the next 15 hours. It has tested this line in the past, so one should probably wait for a confirmation of this breakout before taking action. If the breakout doesn’t confirm, we could see a retracement back to lines seen in the last 4 days.
Past performance is not an indicator of future results.
Trading leveraged products carries significant risk. Please refer to PDS and TMD on our website. AFSL#309763
