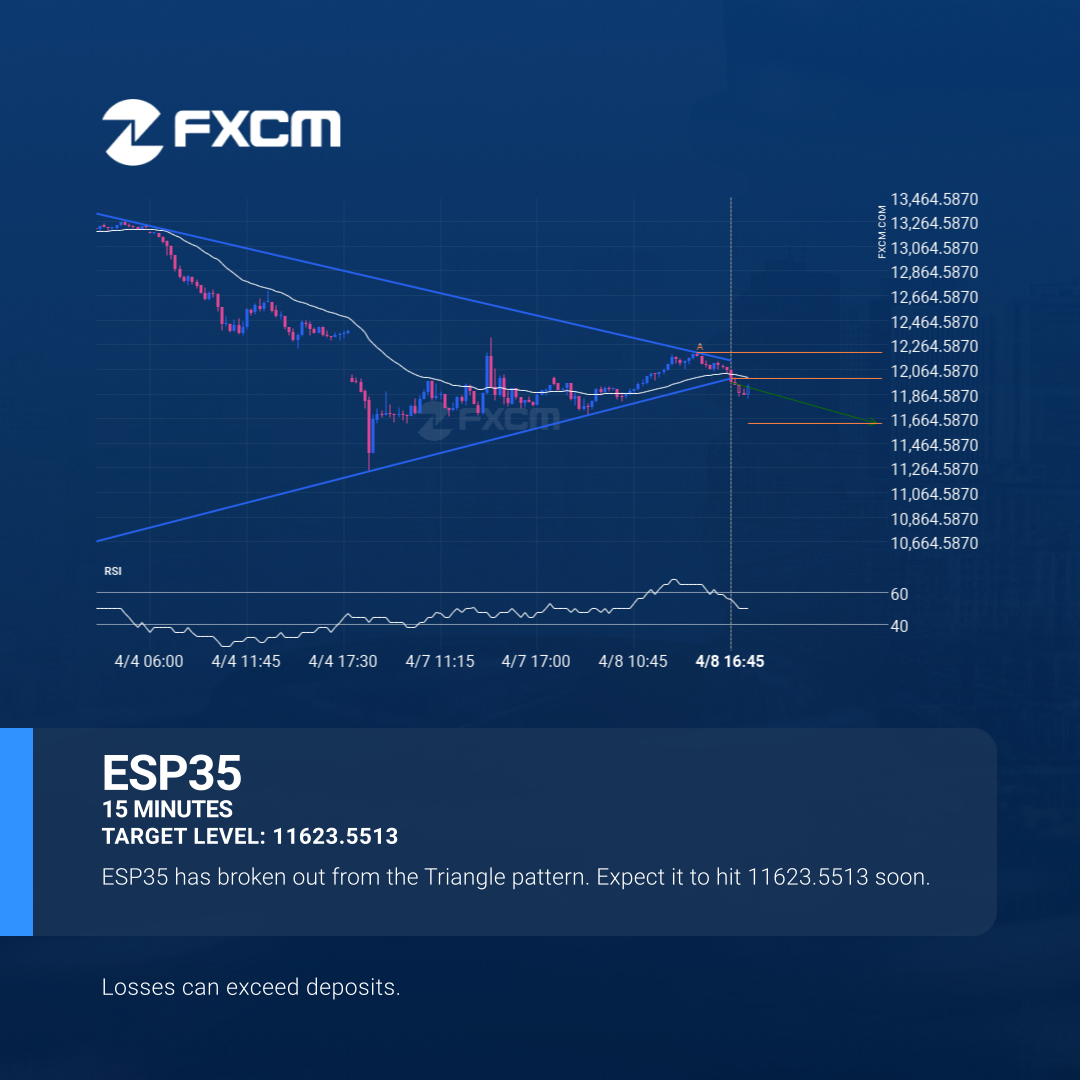
ESP35 moved through the support line of a Triangle at 11989.639615384616 on the 15 Minutes chart. This line has been tested a number of times in the past and this breakout could mean an upcoming change from the current trend. It may continue in its current direction toward 11623.5513.
Past performance is not an indicator of future results.
Losses can exceed deposits.